Gallery
Every screenshot on this page is captured from a self-contained, runnable
script in examples/ —
each exposes a build() (returns the widget) and a main() (shows a window):
uv run python examples/01_hello.py
Showcase
Larger scenarios that combine several features around a realistic dataset.
Sensor telemetry
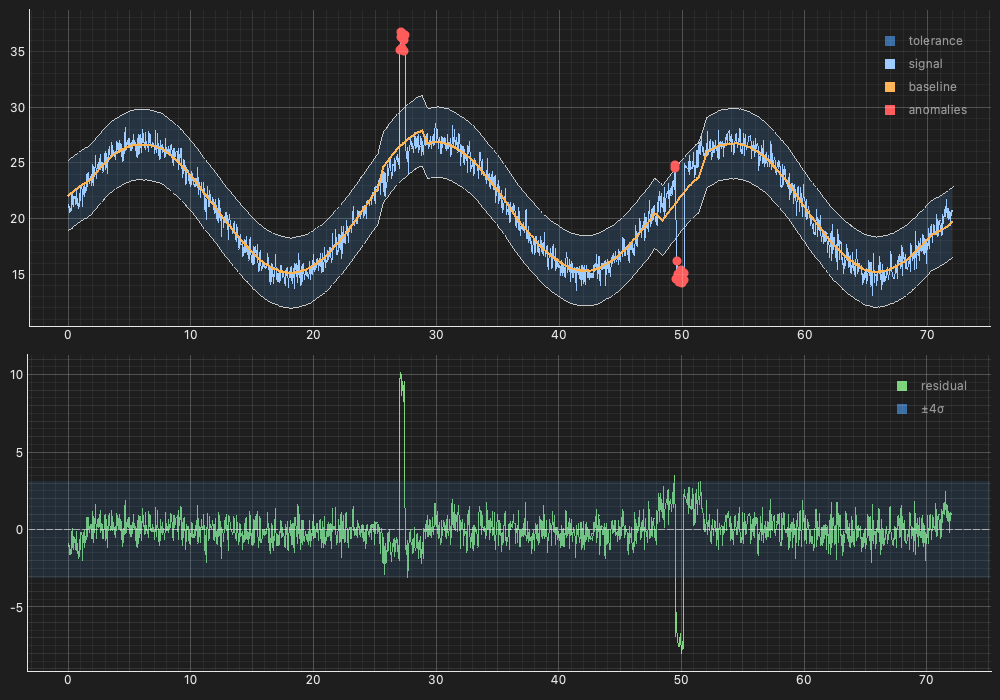
A rolling baseline, a 3σ tolerance Spread, flagged-anomaly Scatter, and an
X-linked residual panel derived with an Expression —
26_telemetry_monitoring.py
Market analytics
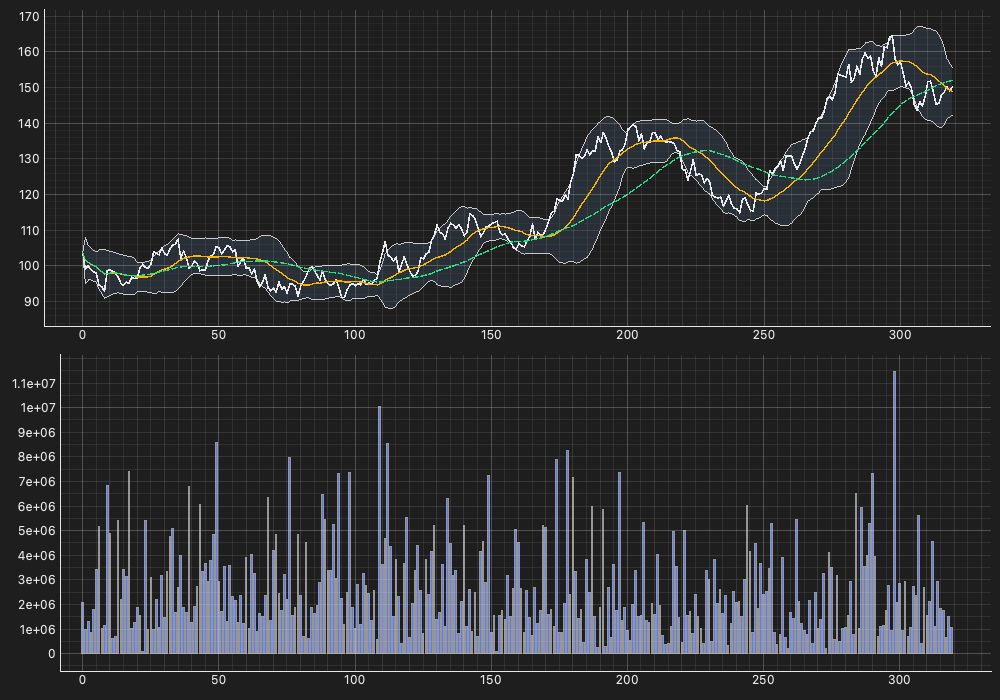
Price Curve + 20/50-day moving averages + a Bollinger Spread, over an
X-linked volume Bars panel —
27_market_analytics.py
Streaming telemetry
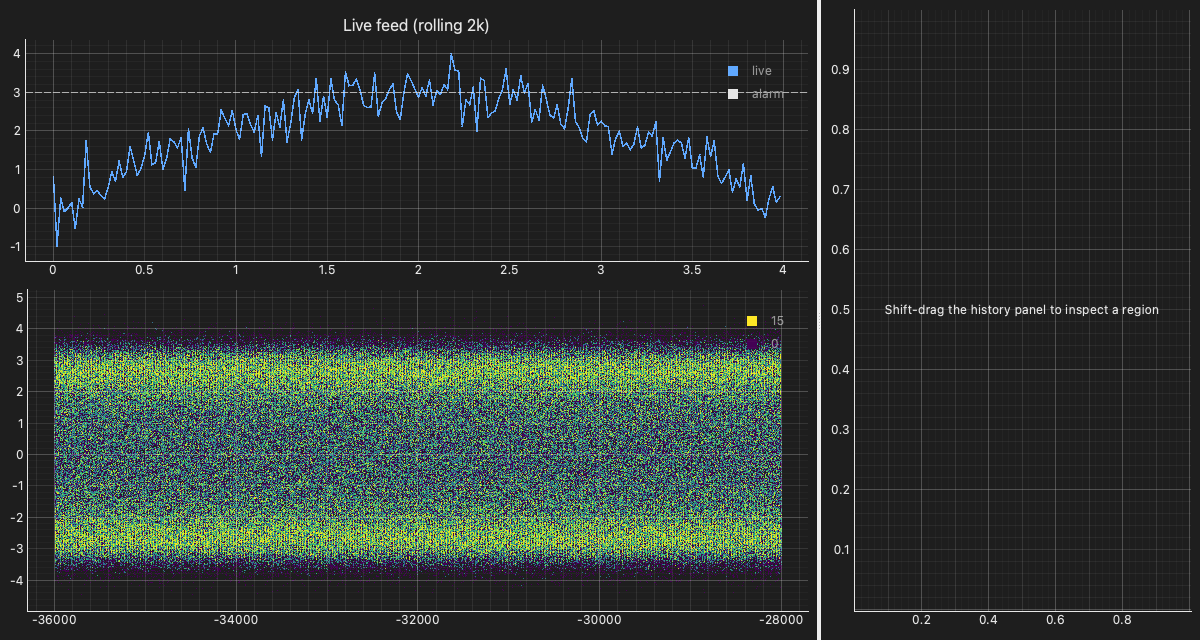
A live rolling feed (qv.stream), its 400k-point history datashaded, and a
brush-driven detail panel wired through a Signal —
34_streaming_telemetry.py
The everyday figures
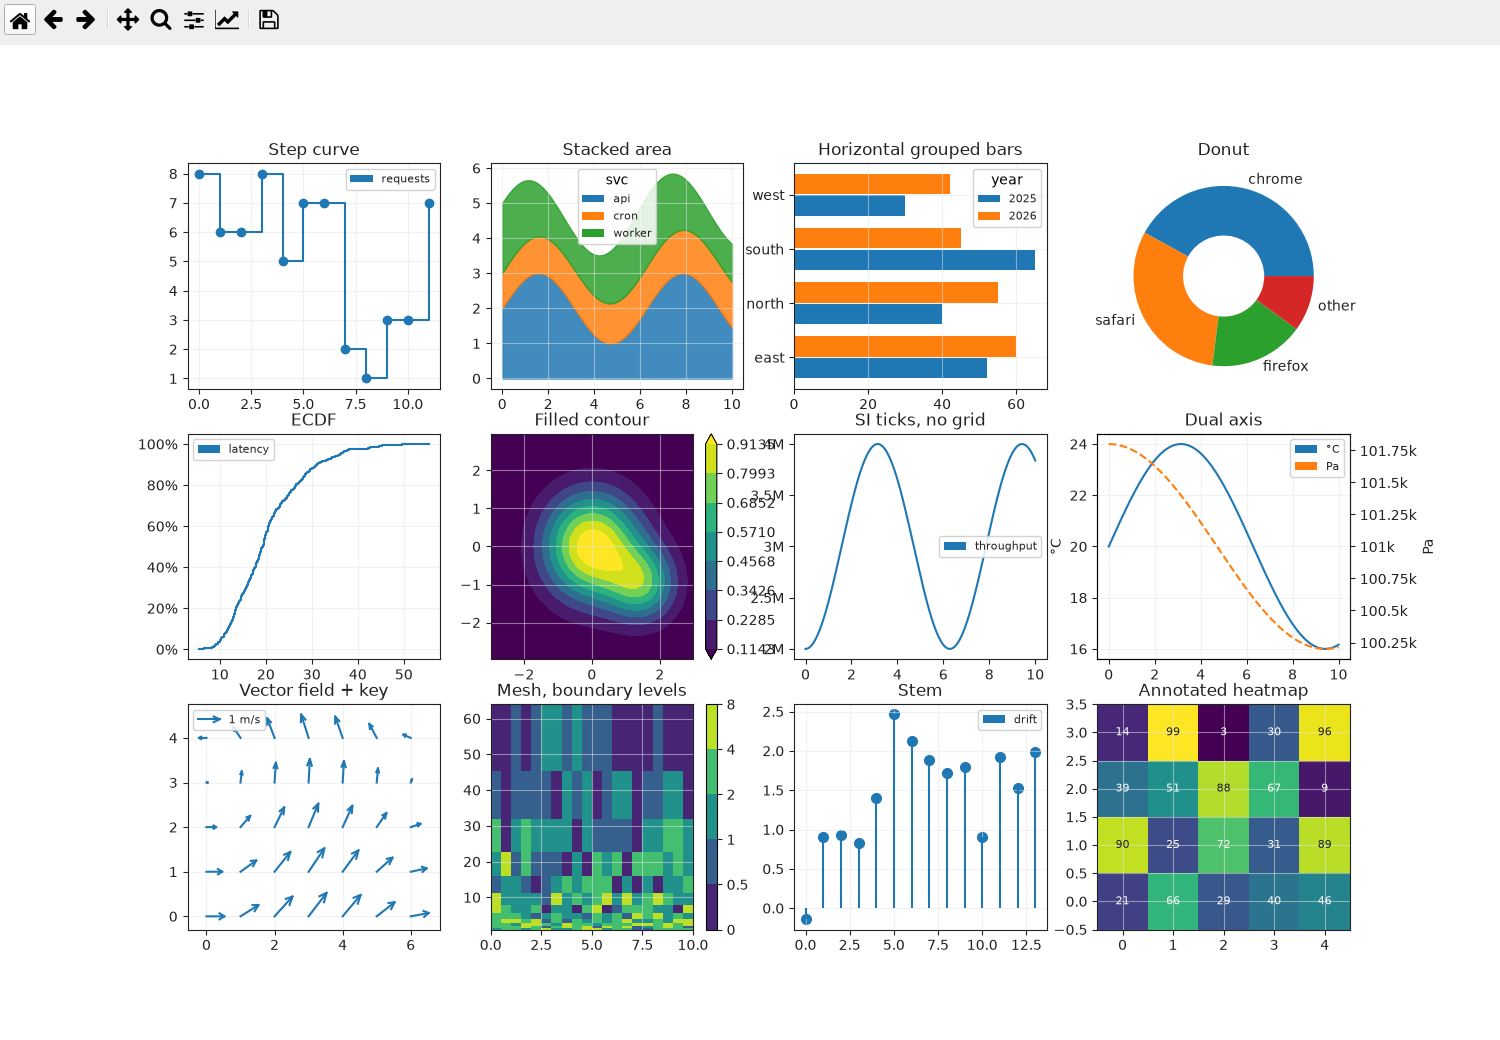
Step curve, stacked Area, horizontal Bars, Pie donut, Ecdf, filled
Contour, SI ticks, a dual-axis pair, Quiver with a reference key, a
boundary-level Mesh, Stem, and an annotated Heatmap — one grid, under the
native toolbar —
35_everyday_figures.py
Linked dashboard
Three panels, shared X, brushing, dark theme — under sixty lines —
dashboard_native.py
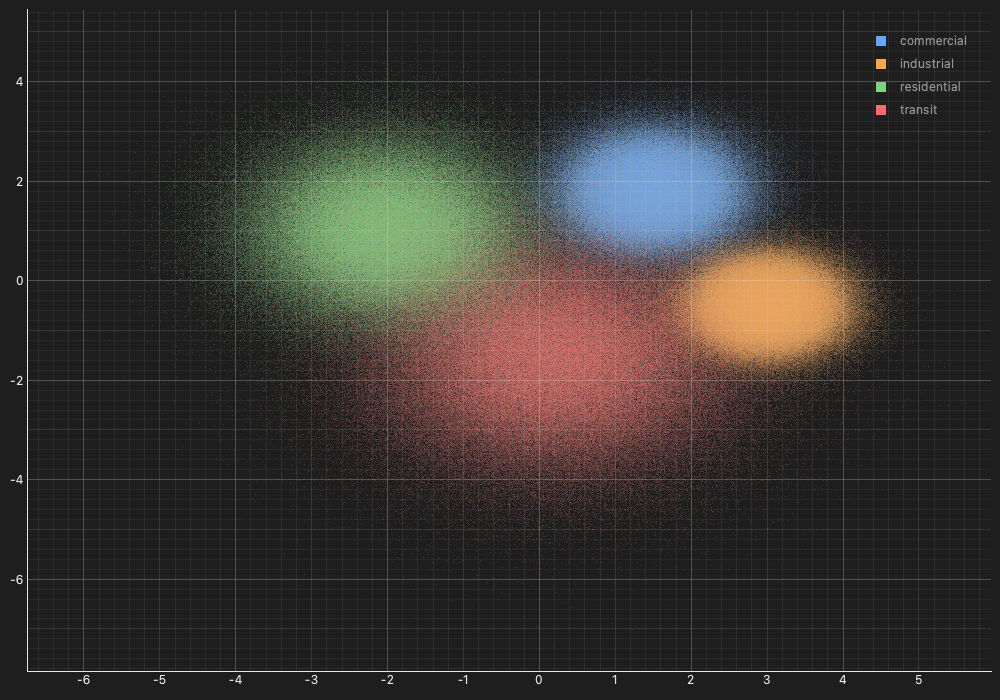
Big-data density map
2M categorized events datashaded into a categorical density map; hover reports
the count under the cursor —
28_event_density_map.py
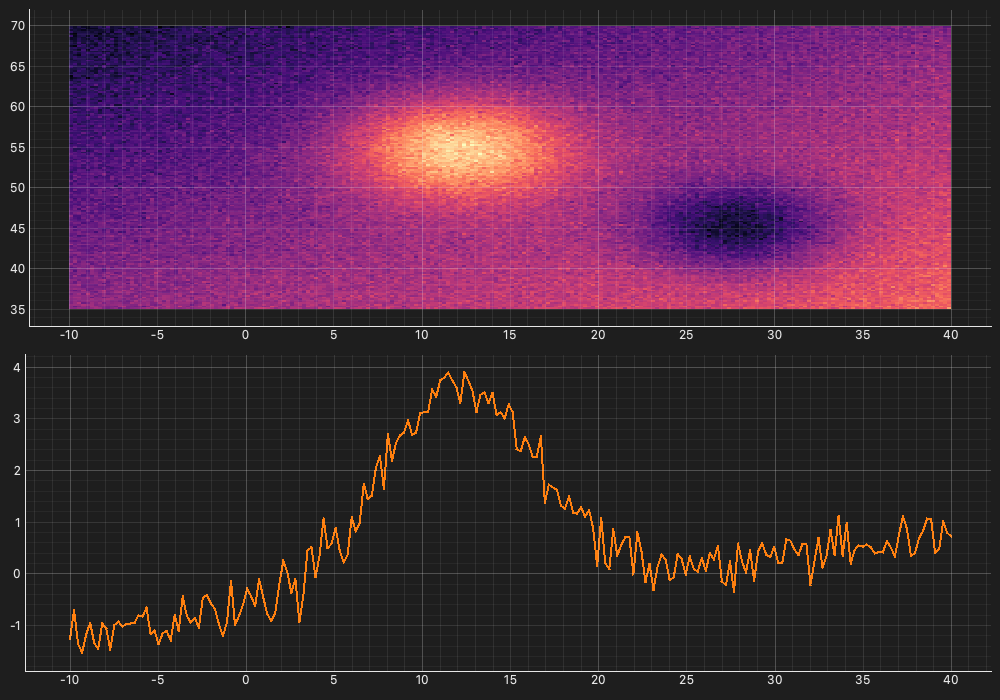
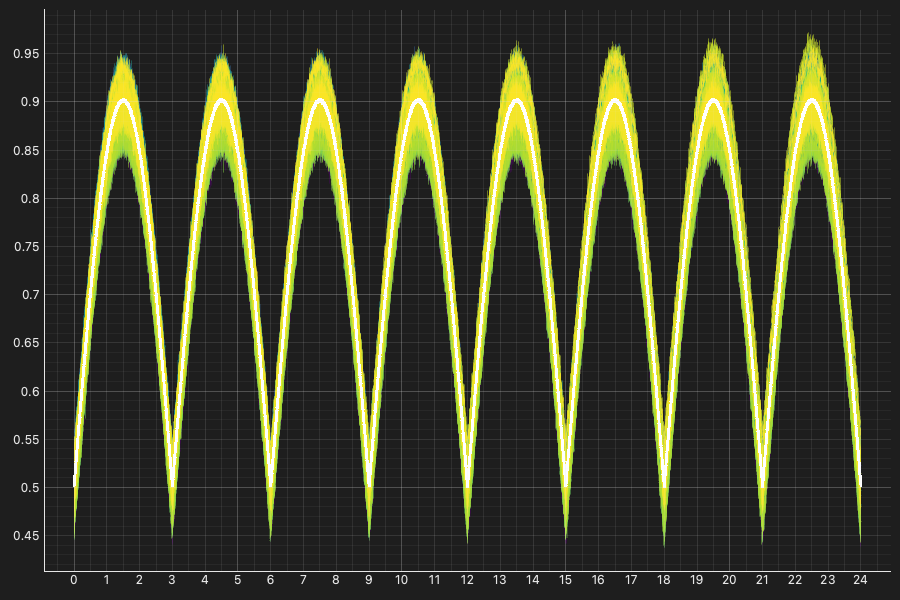
Gridded science
An xarray 2-D field as an Image map plus a 1-D cross-section Curve, and a
3-D cube overlaying 250 instance lines with a mean envelope —
29_climate_field.py ·
30_xarray_sensor_lines.py
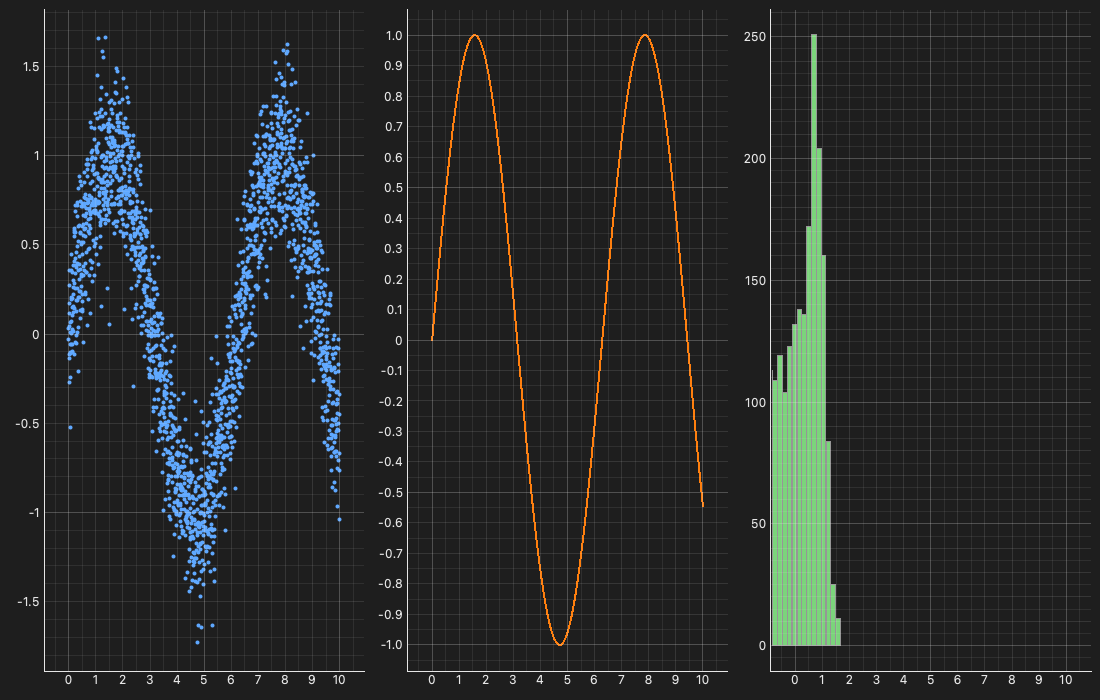
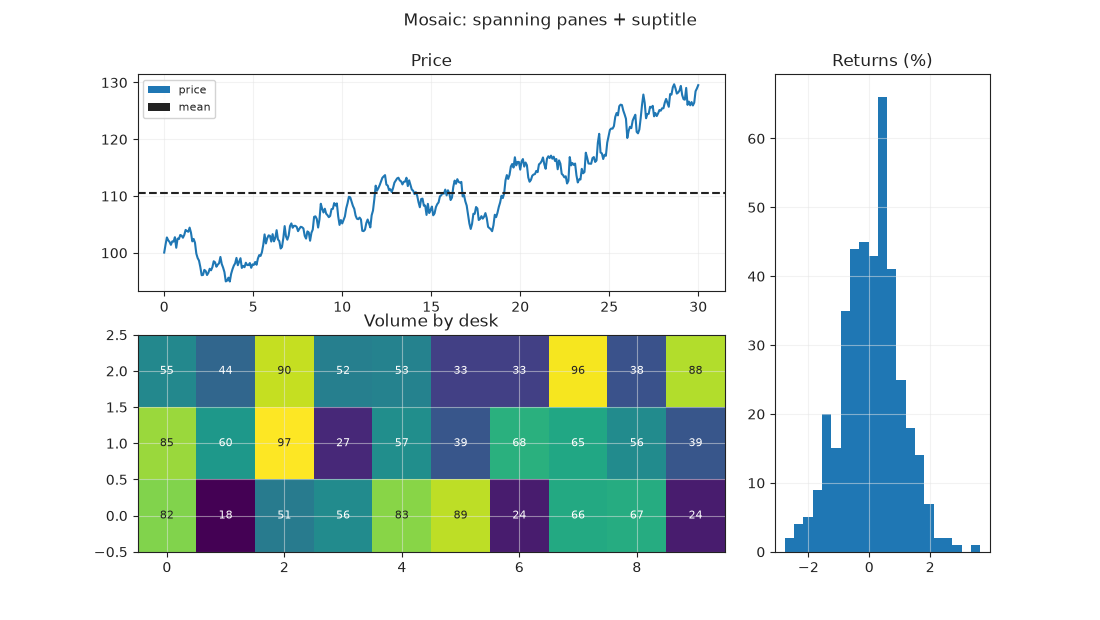
Mosaic layout
Layout.mosaic("AAB\nCCB", …) — spanning panes from an ASCII plan, track
ratios, and a figure suptitle —
36_mosaic_layout.py
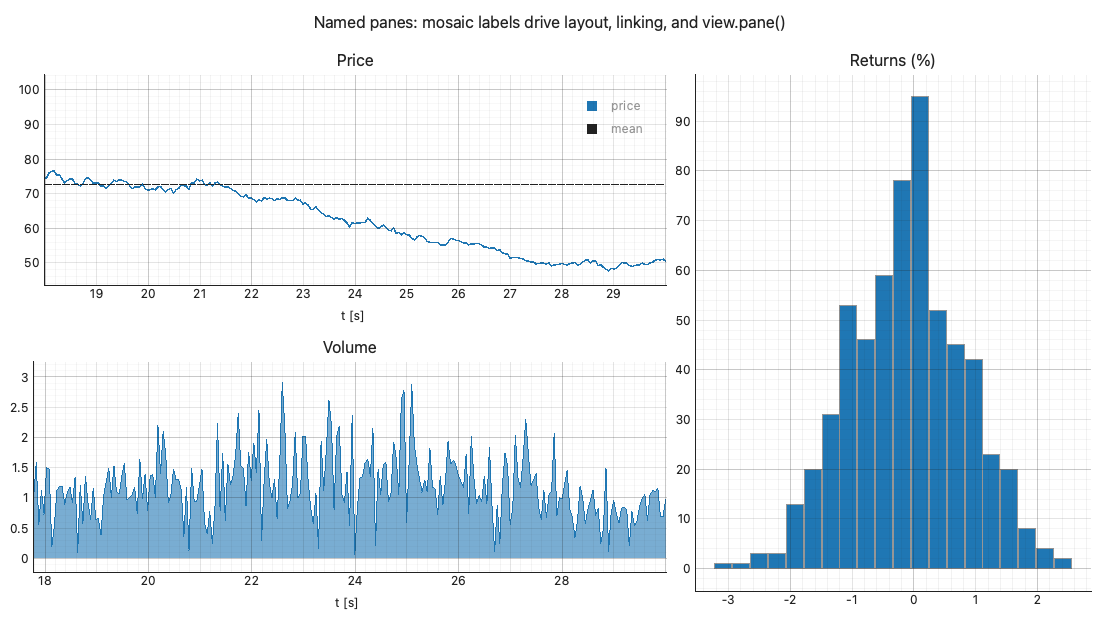
Named panes — the mosaic's list form names every subplot ("price",
"volume", "depth"), link_x="col" keeps a column time-aligned, and the
same names address the live render: view.pane("price").set_range(x=…) zooms
programmatically (the linked pane follows), pane.export(...) writes one
pane, view.on(..., pane="price") scopes events —
37_named_panes.py
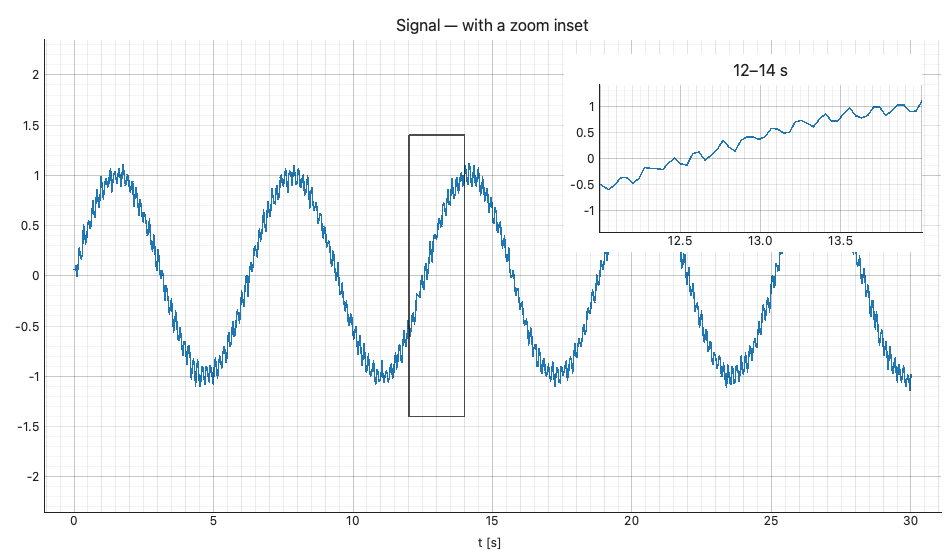
Inset axes — overview * qv.Inset(zoom, rect=…, label="zoom",
indicate=True): a child surface floating on its parent with the zoom
window marked on the parent; the labeled inset is a pane
(view.pane("zoom").set_range(…), pane-scoped events, per-pane export,
state that survives backend switches) —
38_inset_zoom.py
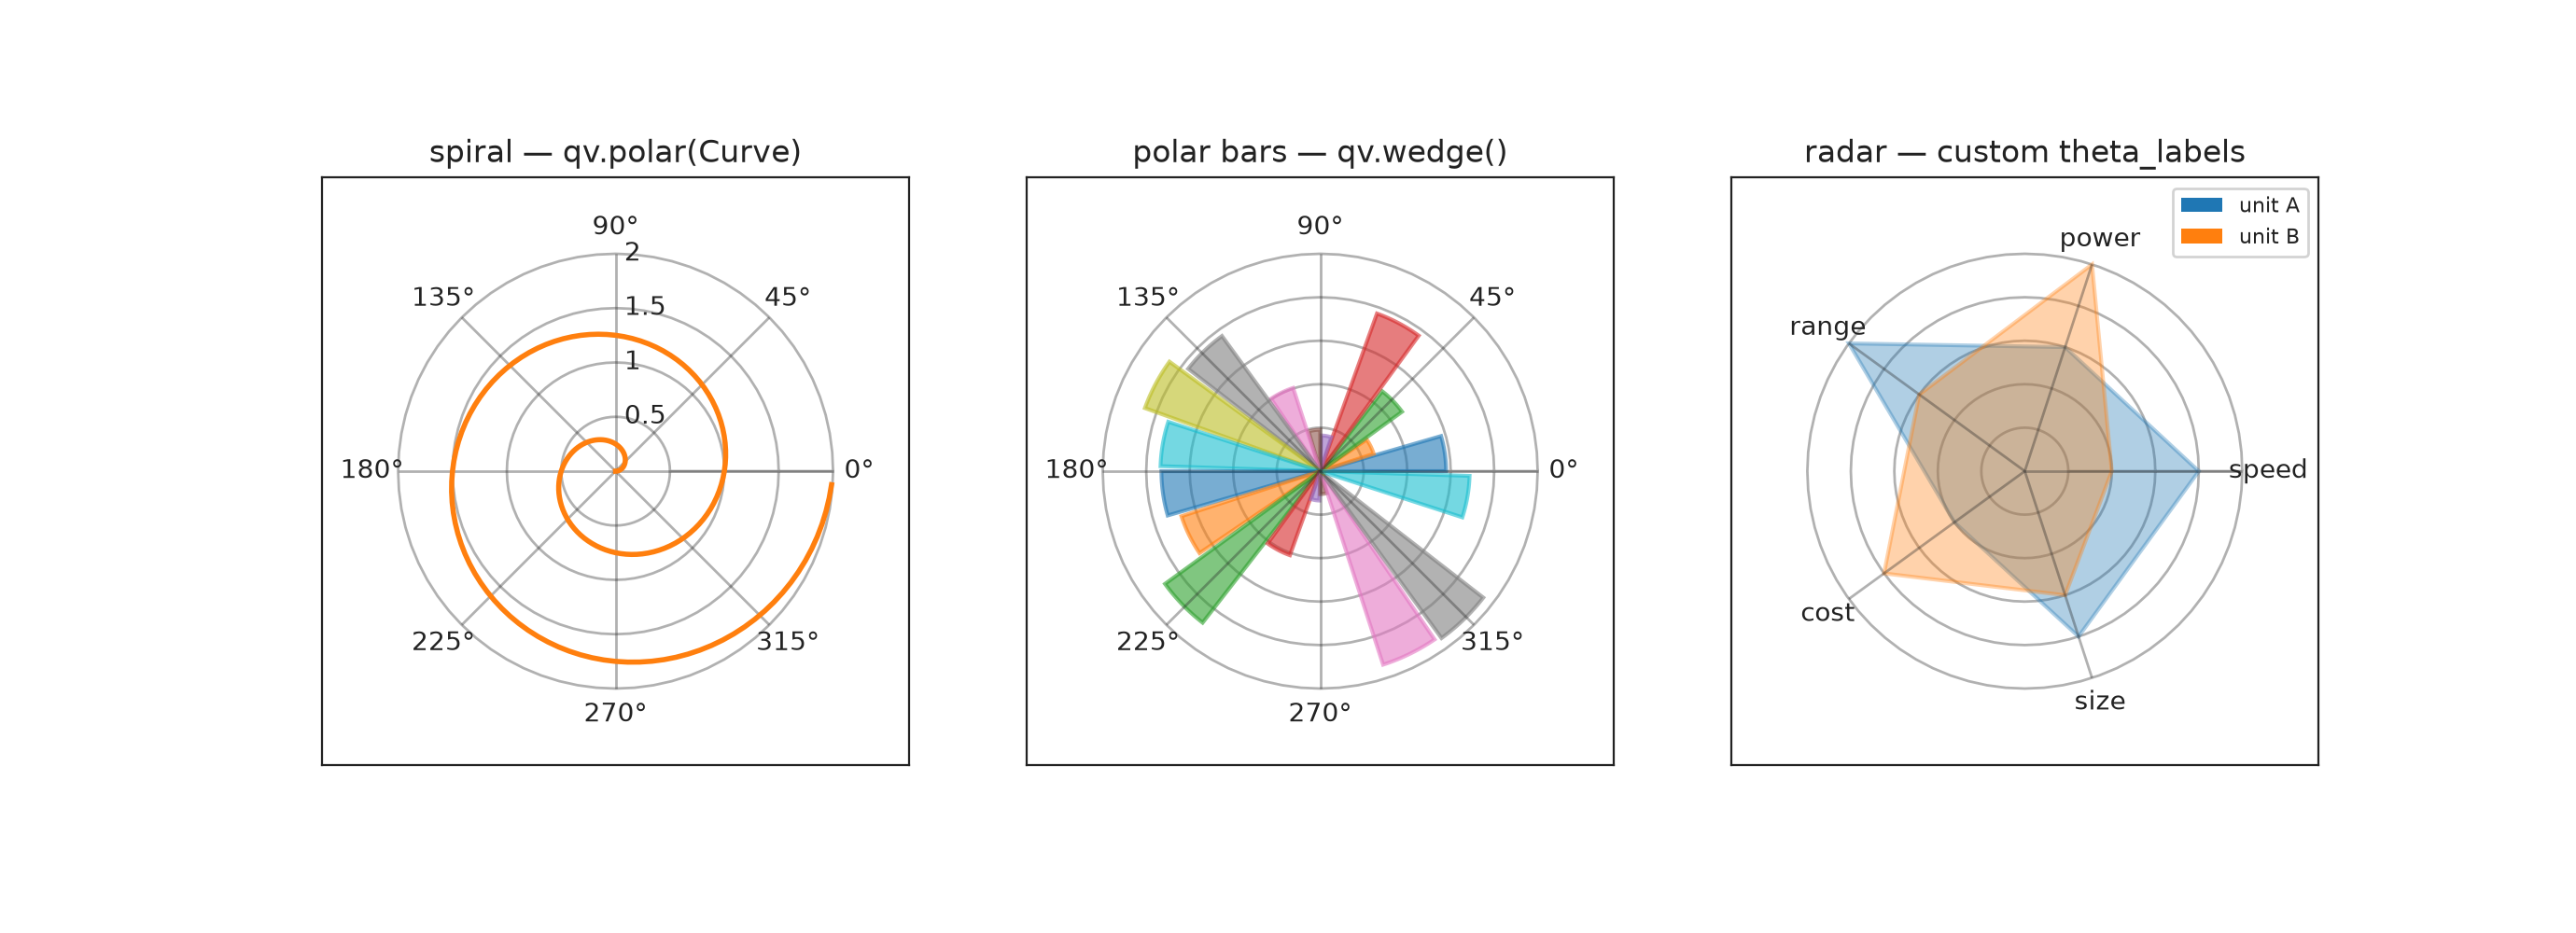
Polar plots ([D119]) — polar as a transform: qv.polar(element)
reinterprets x/y as (θ, r), qv.PolarGrid draws the circular chrome
(degree or custom spoke labels — the radar case), qv.wedge() builds
polar bars; the surface stays rectilinear, so pan/zoom/state/backends
all keep working —
39_polar.py
Getting started
-
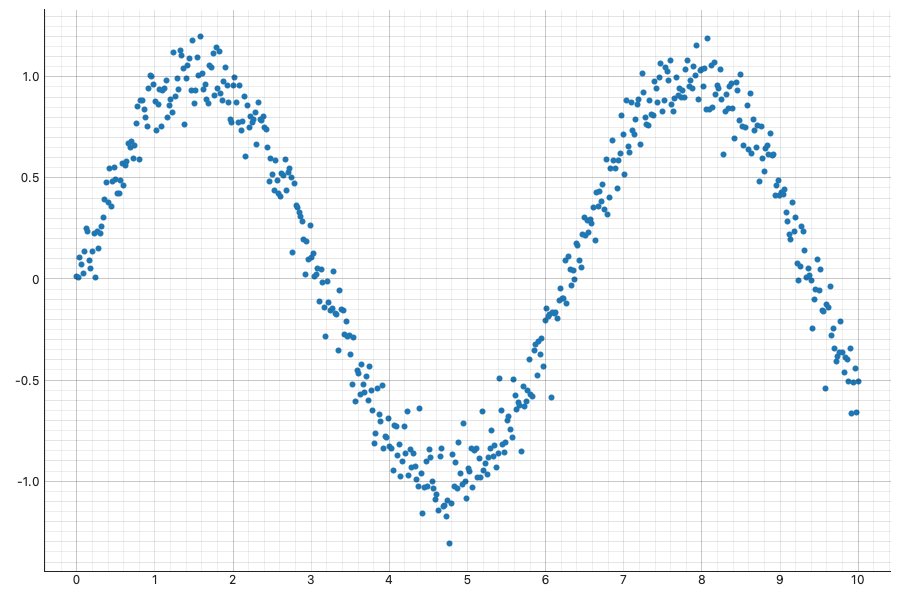
The smallest program — a scatter in a
View, six lines. -
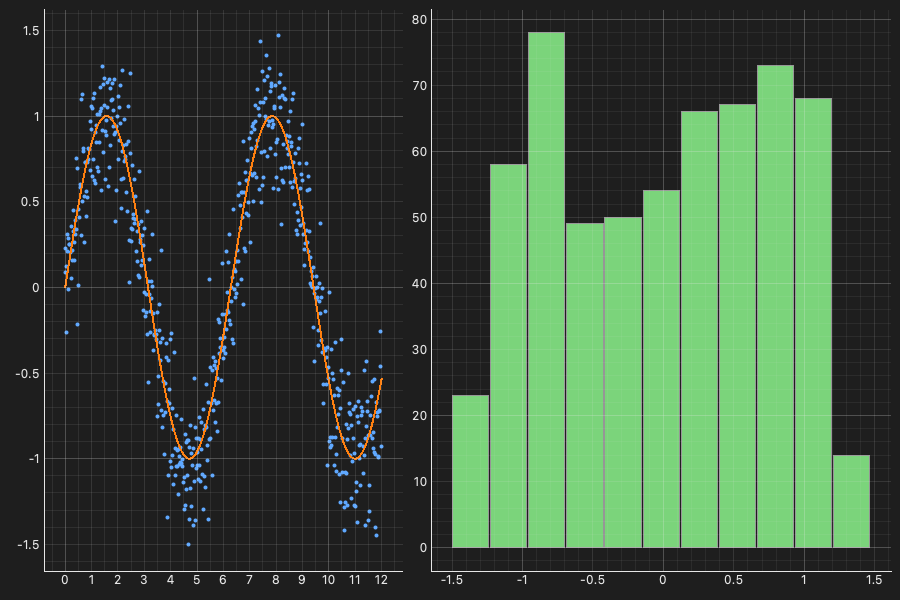
Composition — overlay with
*, lay out with+. -
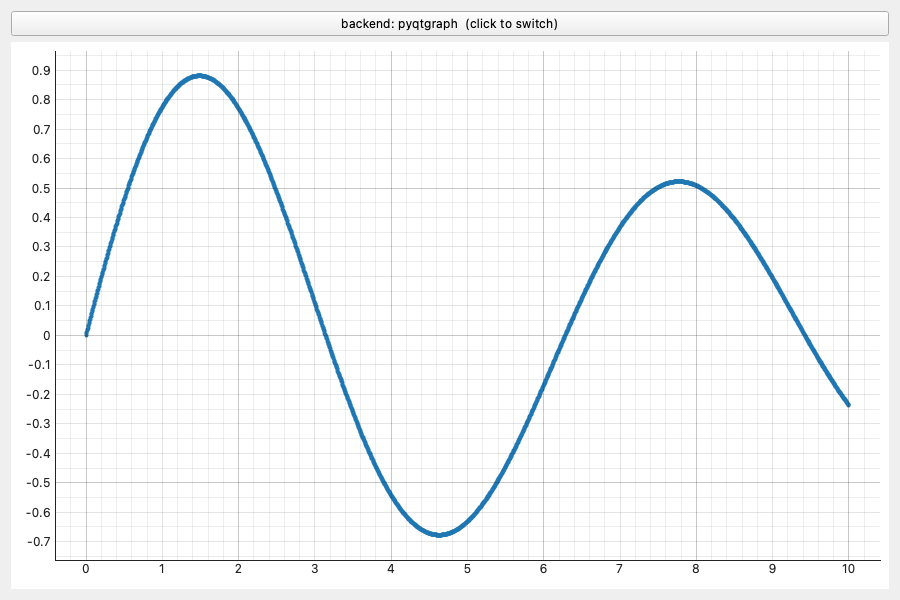
Switch engines at runtime — the same plot via pyqtgraph or matplotlib.
-
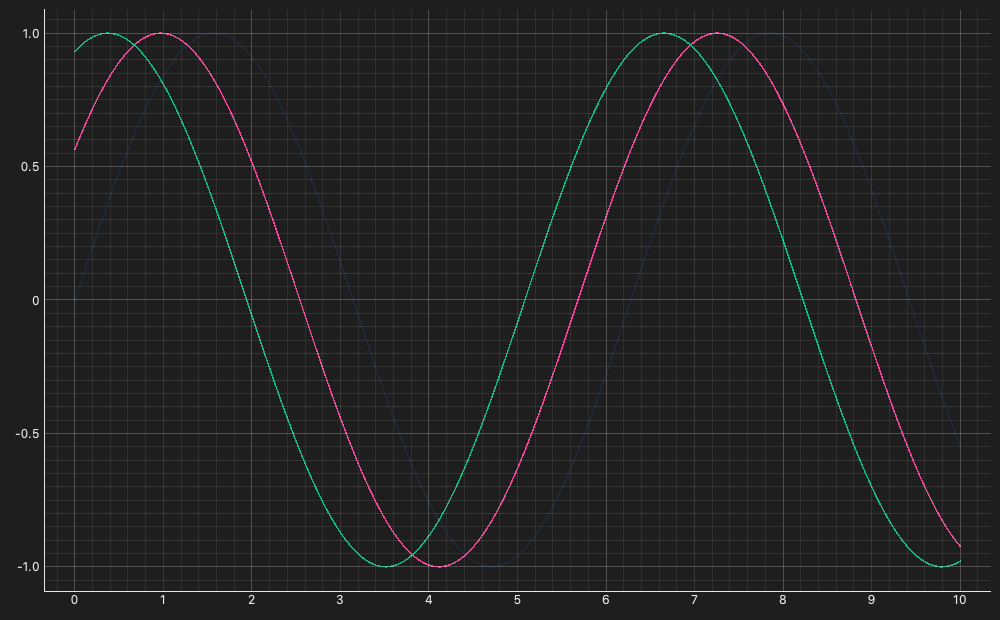
Themes & palettes — light/dark, colors, a registered custom palette.
Core concepts
-
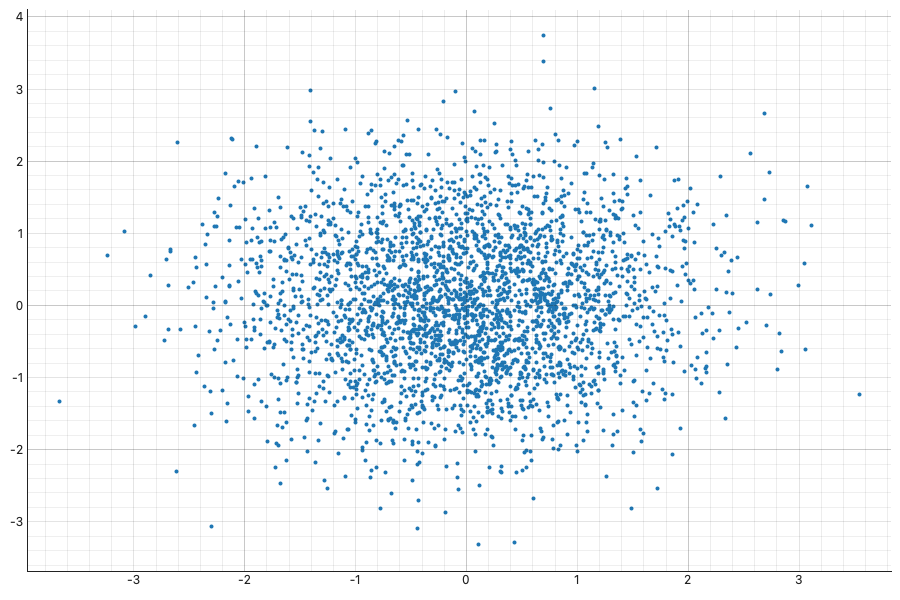
Typed events — brush-select, pick, range.
-
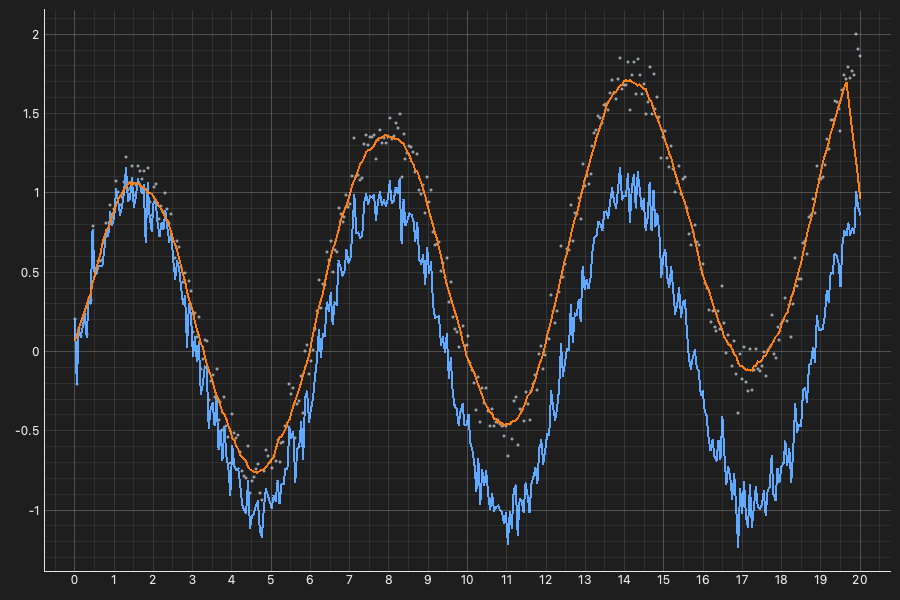
Accessors — bind channels to names,
Expressions, callables, arrays. -
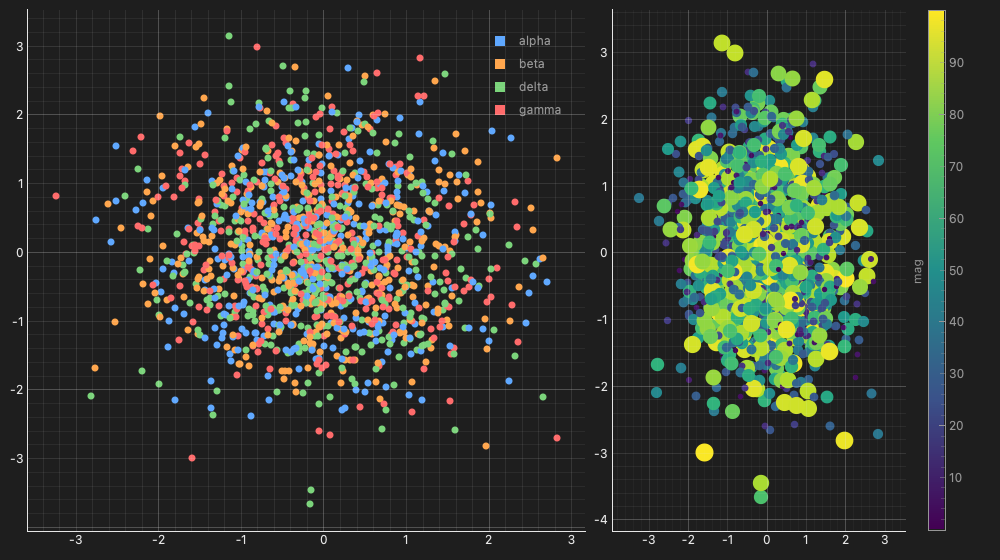
Color & size encoding —
color_by/size_bywith automatic legends. -
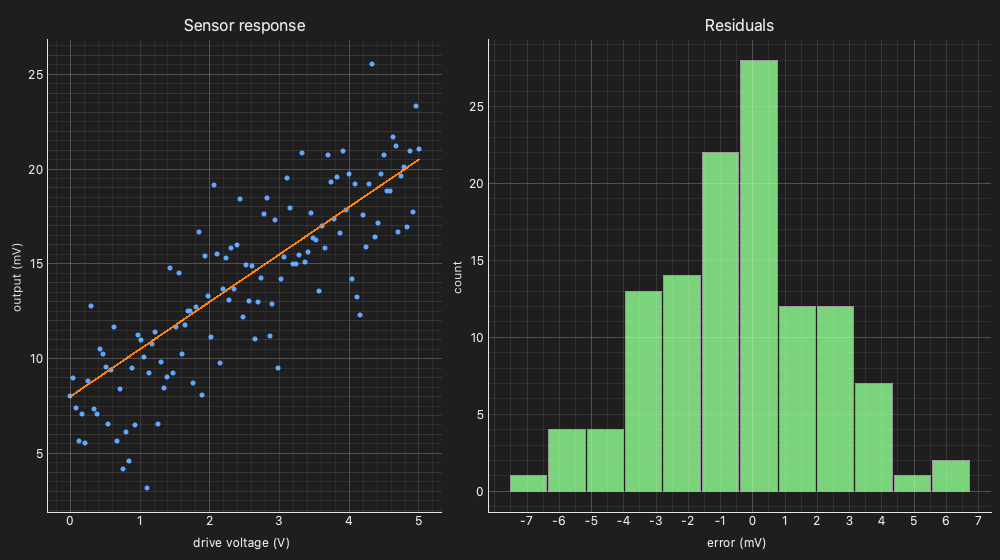
Axis labels & titles —
.opts(title=…, x=…, y=…)on any surface. -
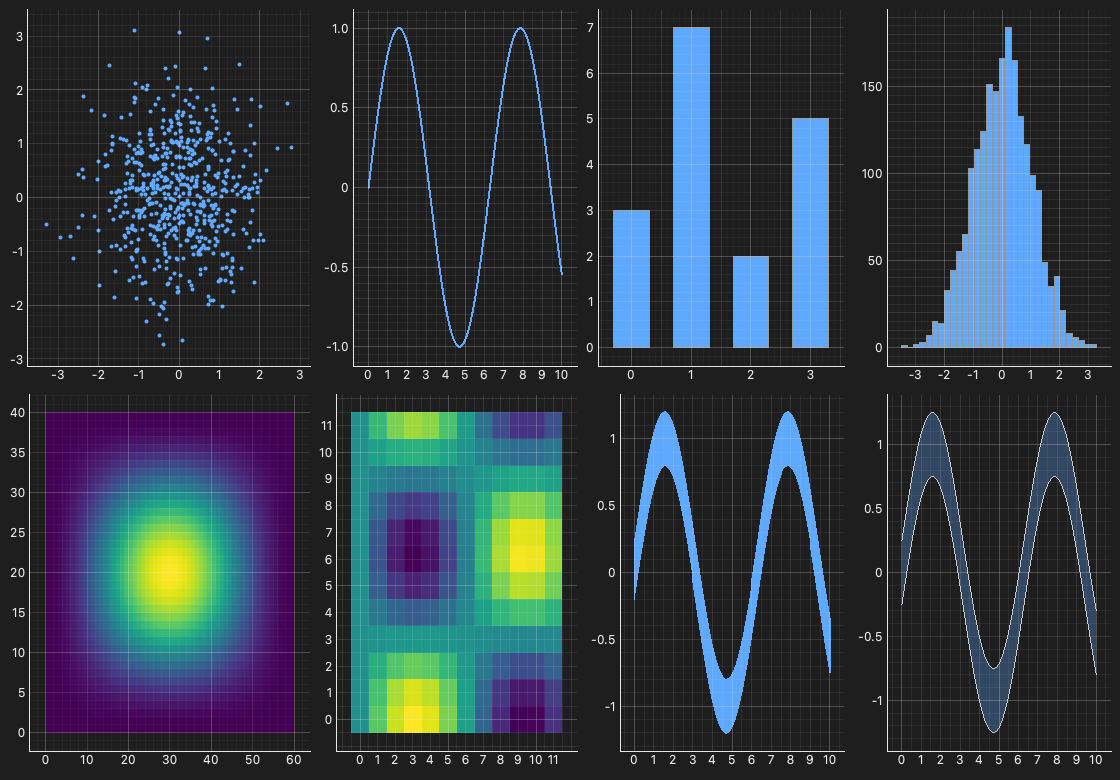
The element vocabulary — the core element types in one grid.
-
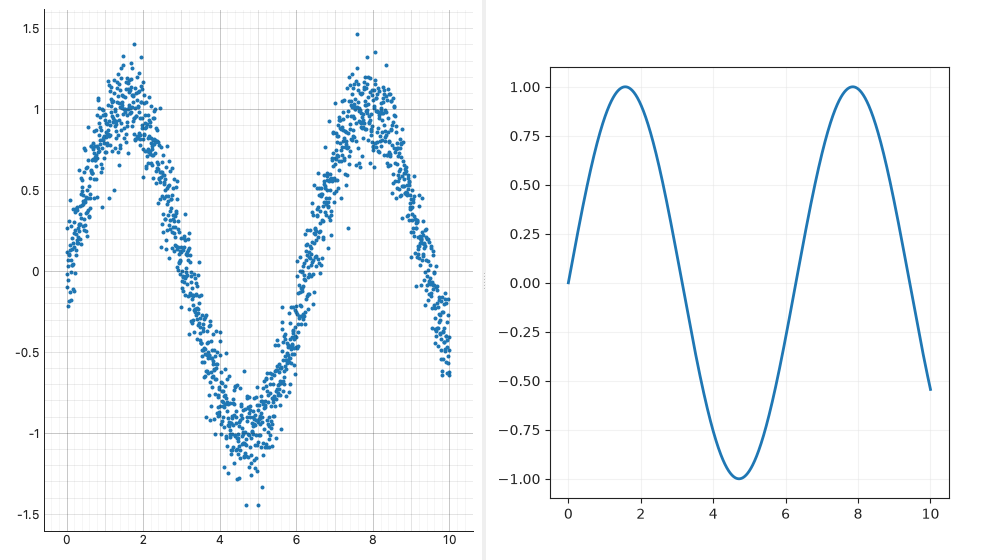
Two engines, one window — pyqtgraph beside matplotlib, one event stream.
-
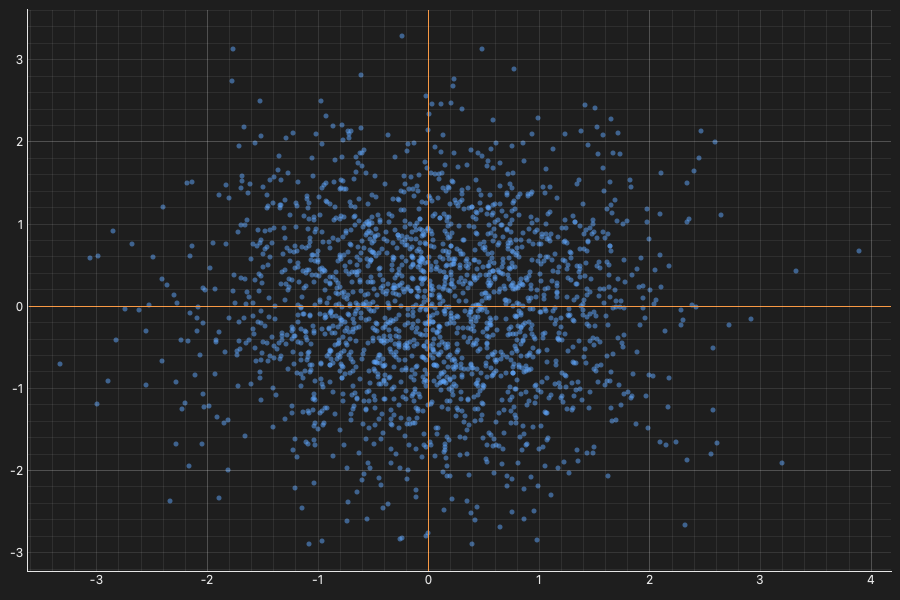
The native escape hatch —
view.native(id)returns the live pyqtgraph item.
Big data — Datashader
-
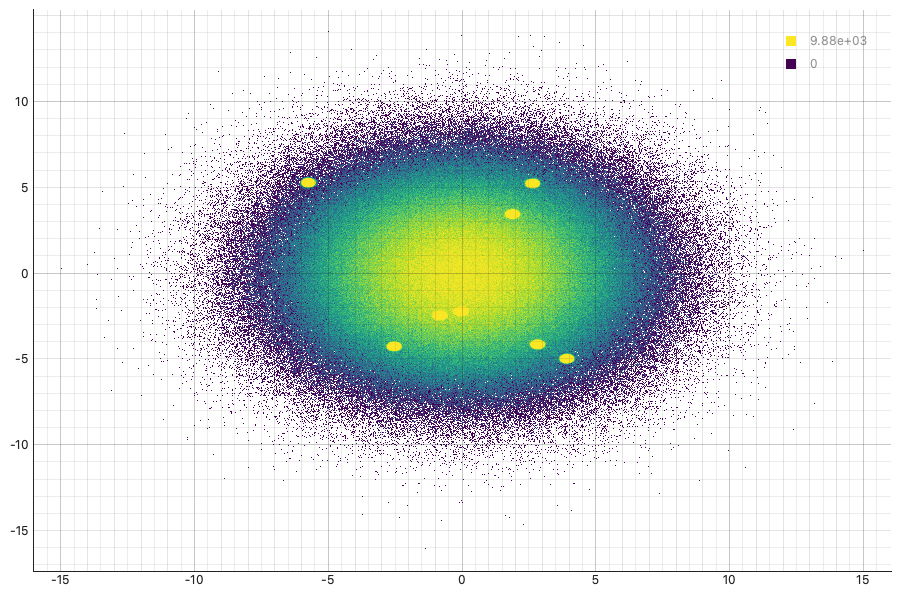
Millions of points — a density raster that re-aggregates to the viewport on zoom.
-
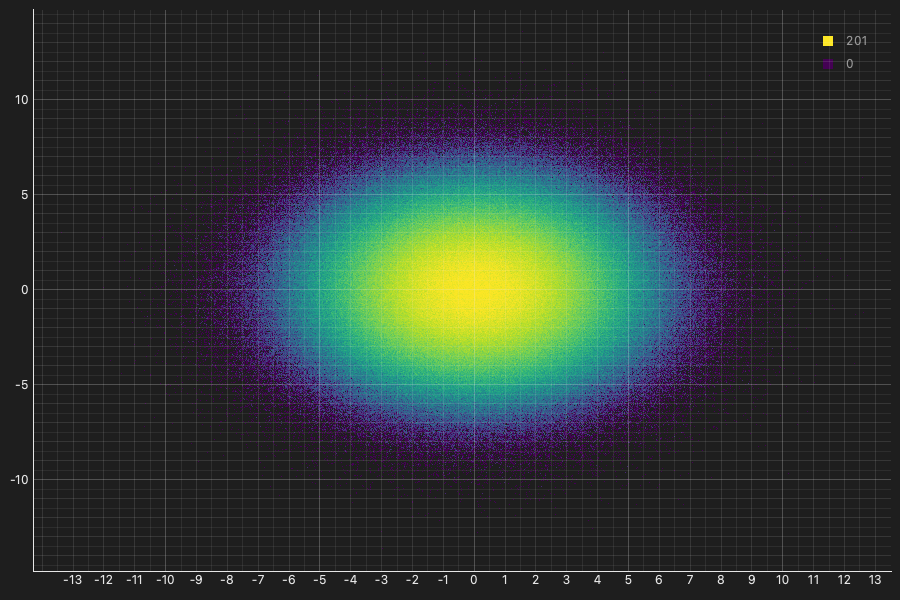
Out-of-core — a lazy Dask DataFrame, never fully materialized.
-
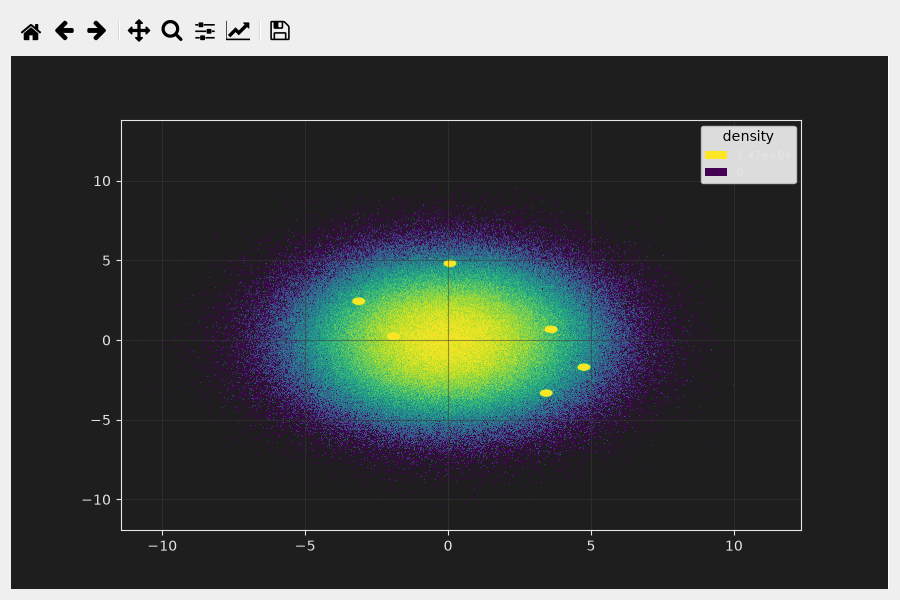
Backend-agnostic rasters — the same datashaded scatter on matplotlib.
-
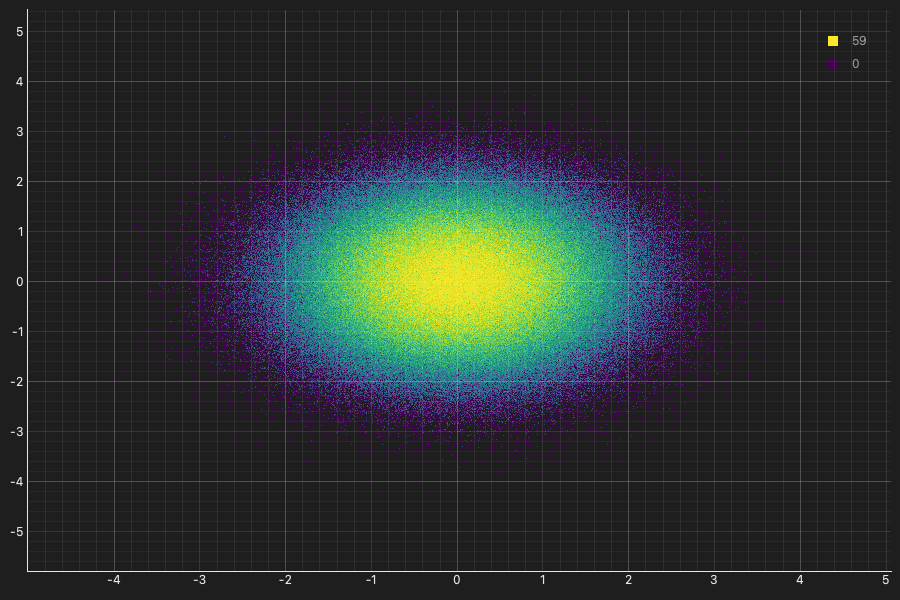
Hover a raster —
HoverEvent.valuereports the count under the cursor. -
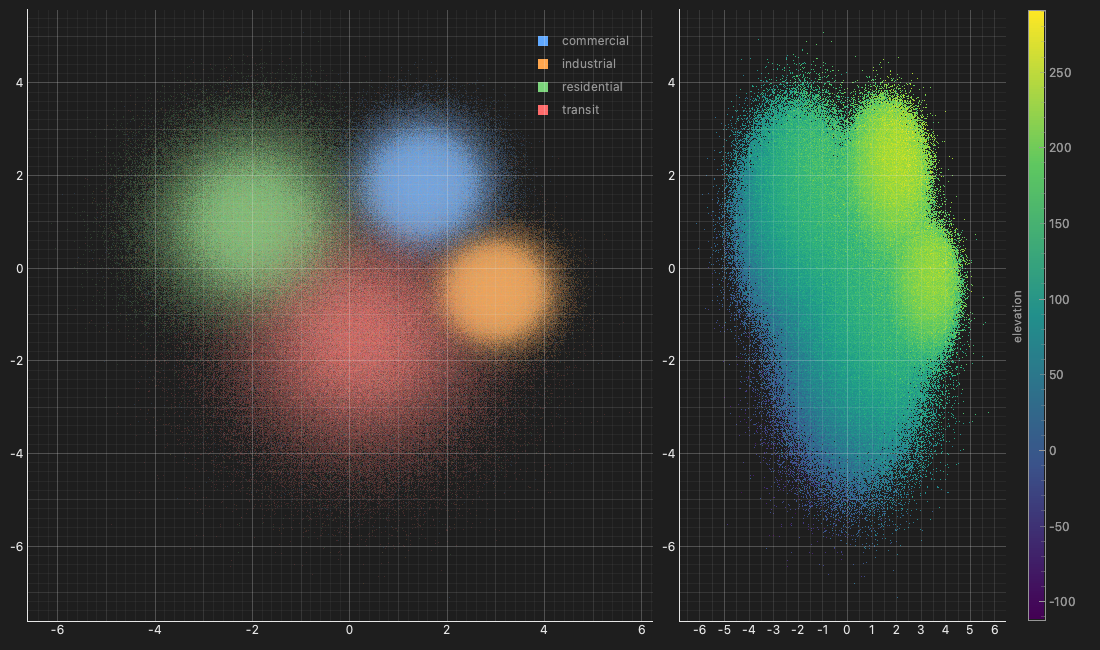
Raster legends & aggregation — a themed category blend with a legend, an
agg="max"raster with a colorbar.
Reactive & adapters
-
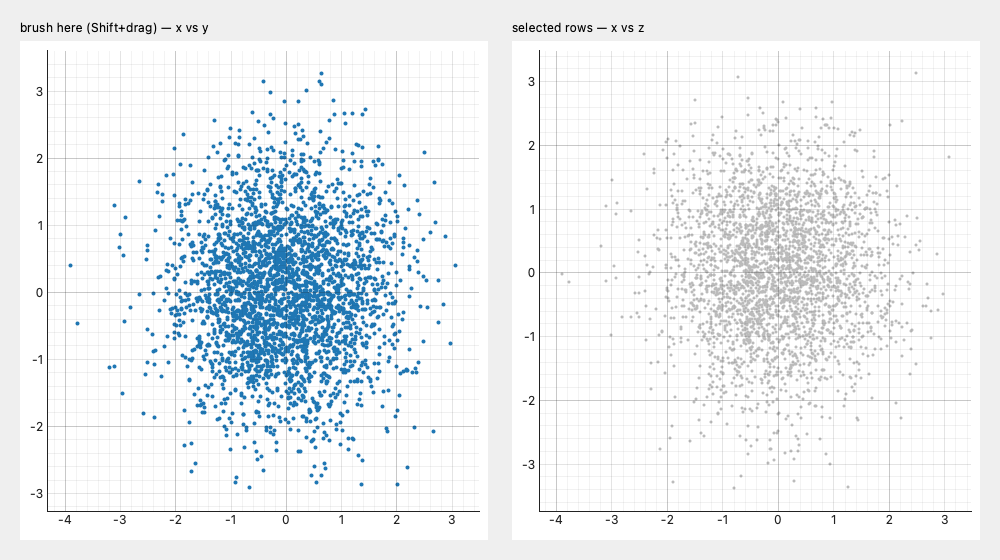
Reactive crossfilter — brush one view; a
Signalre-renders another. -
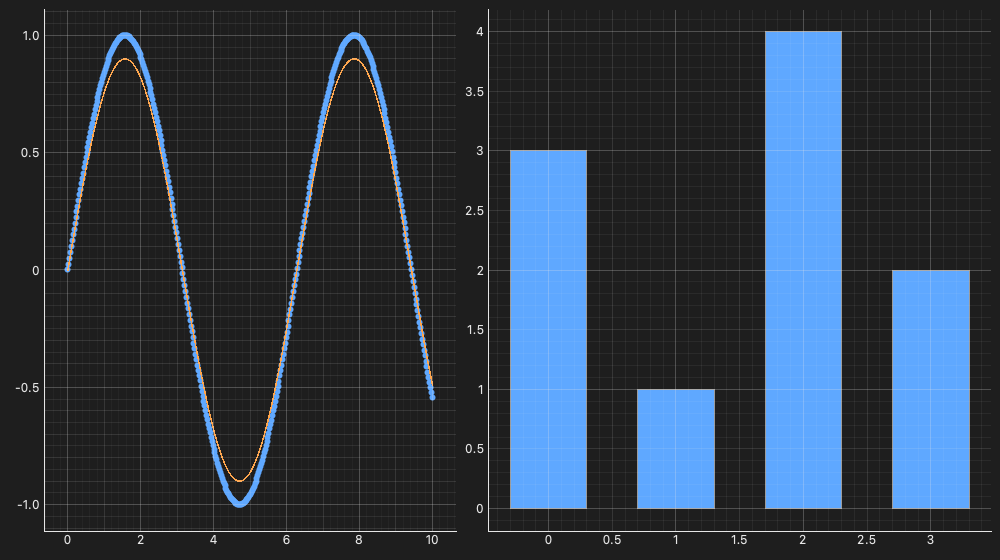
HoloViews, natively — a
scatter * curve + barstree, no browser. -
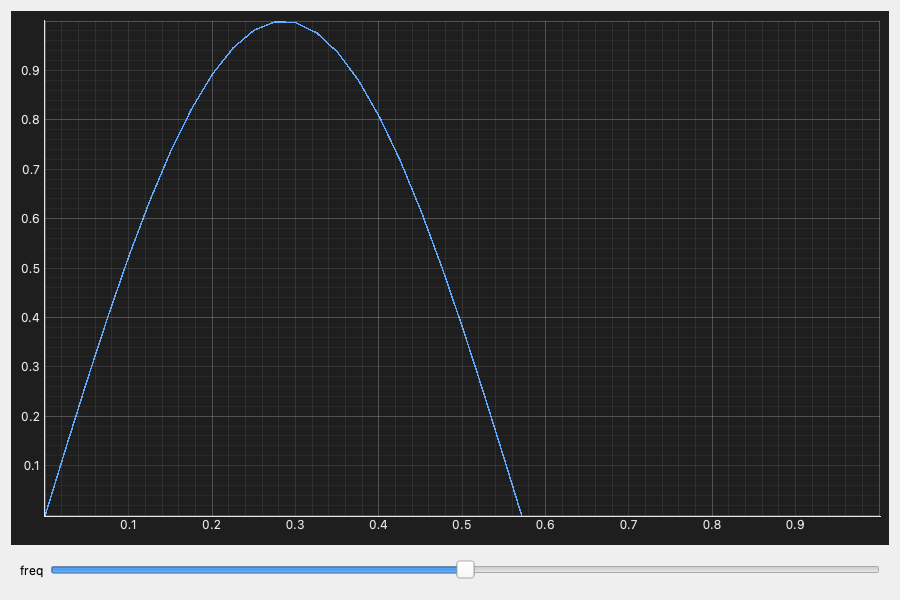
DynamicMap — drive a kdim with a Qt slider; a
Signal[Node]re-renders. -
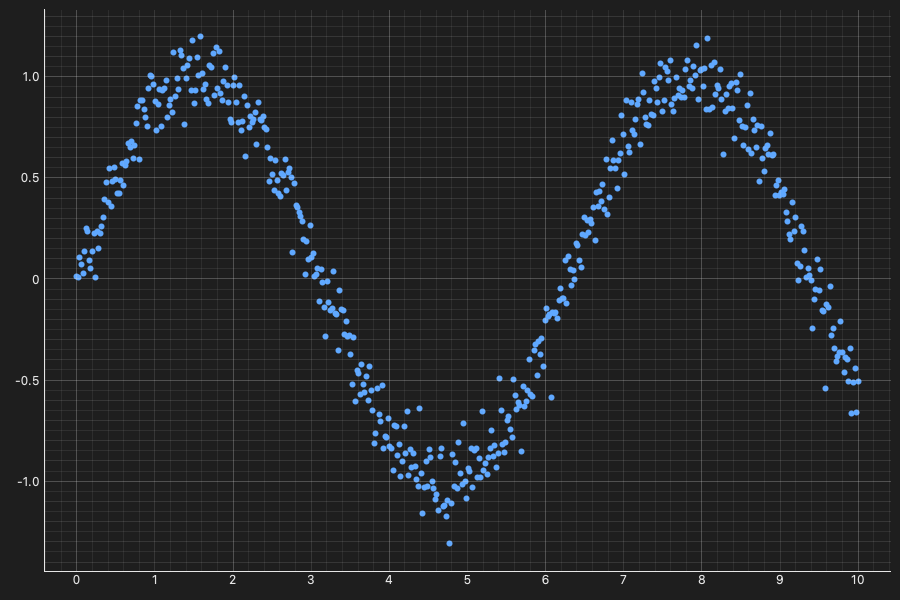
hvplot one-liner —
df.hvplot(kind="scatter")as a native Qt widget.
WebEngine
The same elements rendered as interactive Plotly in a QWebEngineView, plus
RawFigure passthrough for existing Plotly / Bokeh / HoloViews figures.
These need the webengine extra and a real display.
-
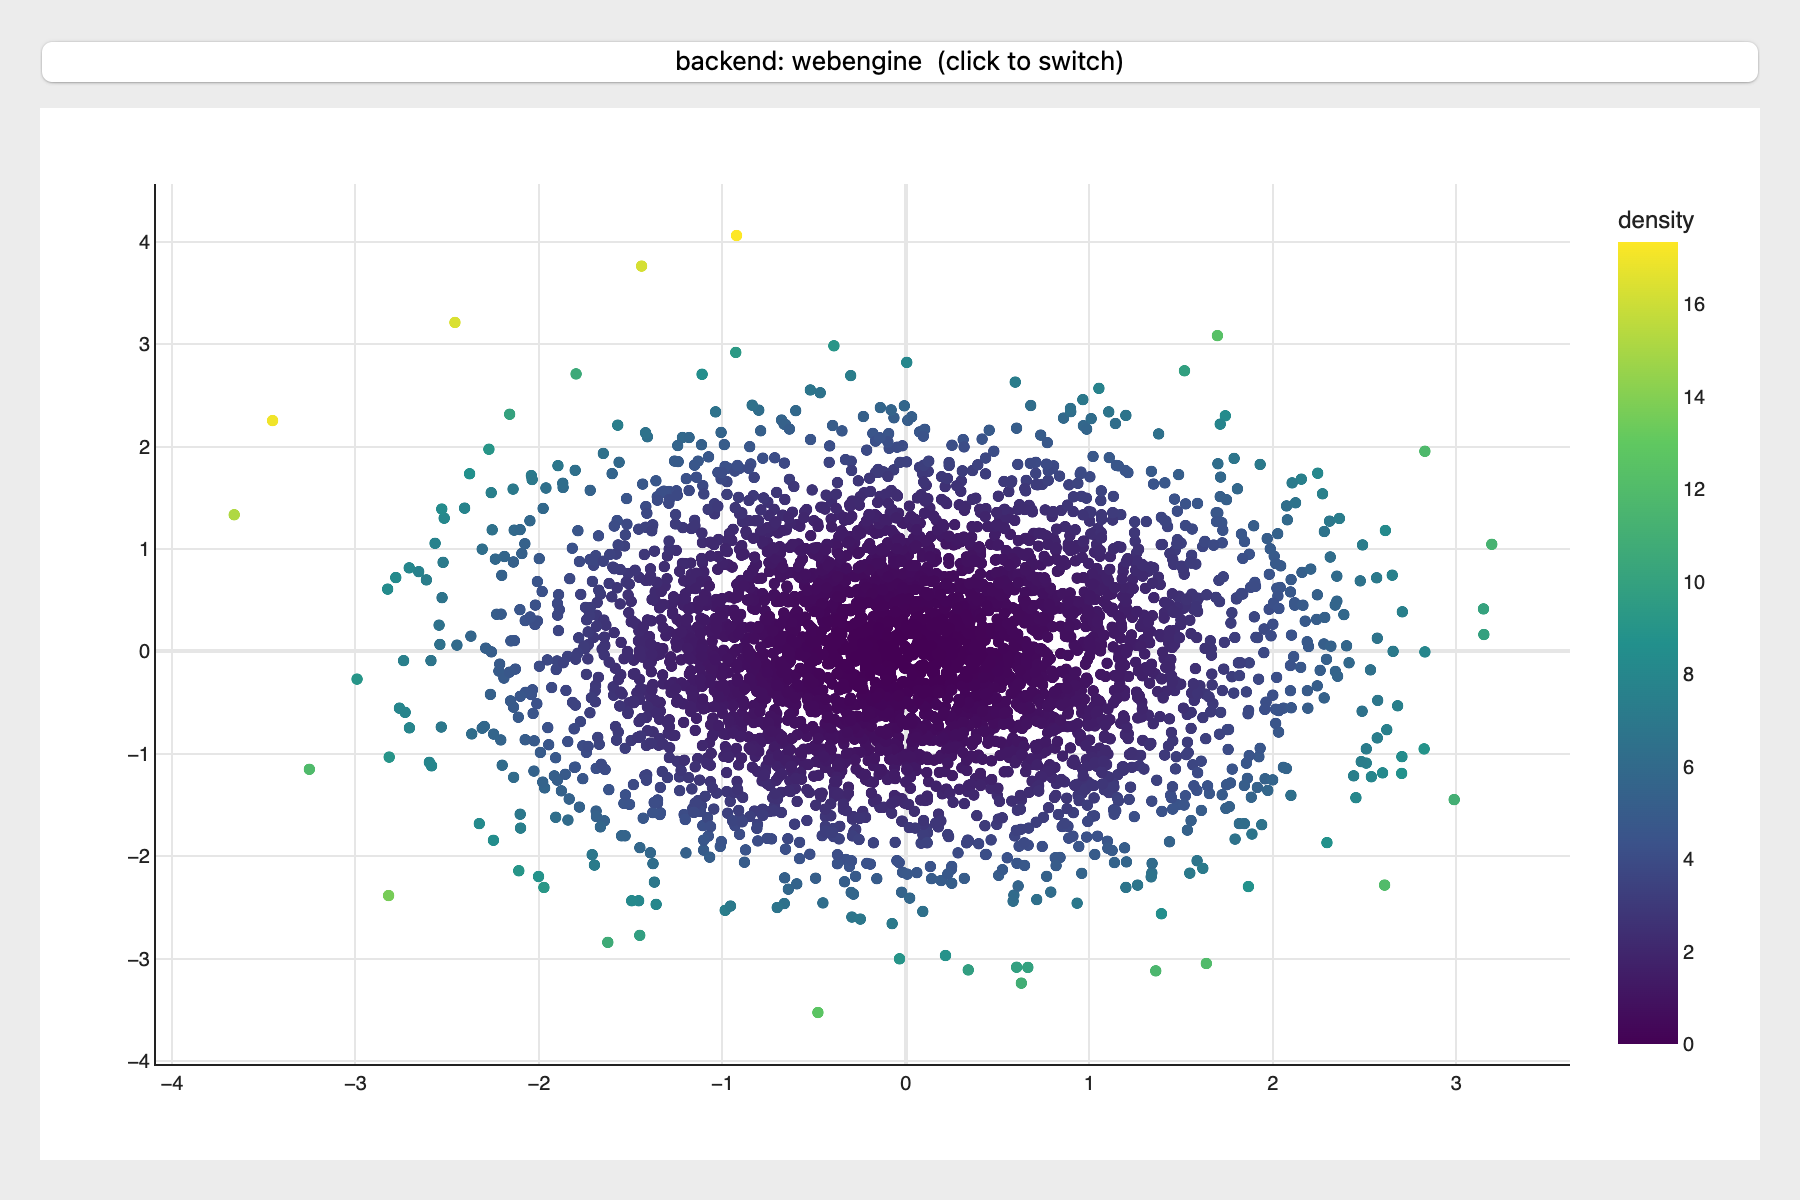
Plotly in a Qt window — typed events bridge back; swap to a native backend live.
-
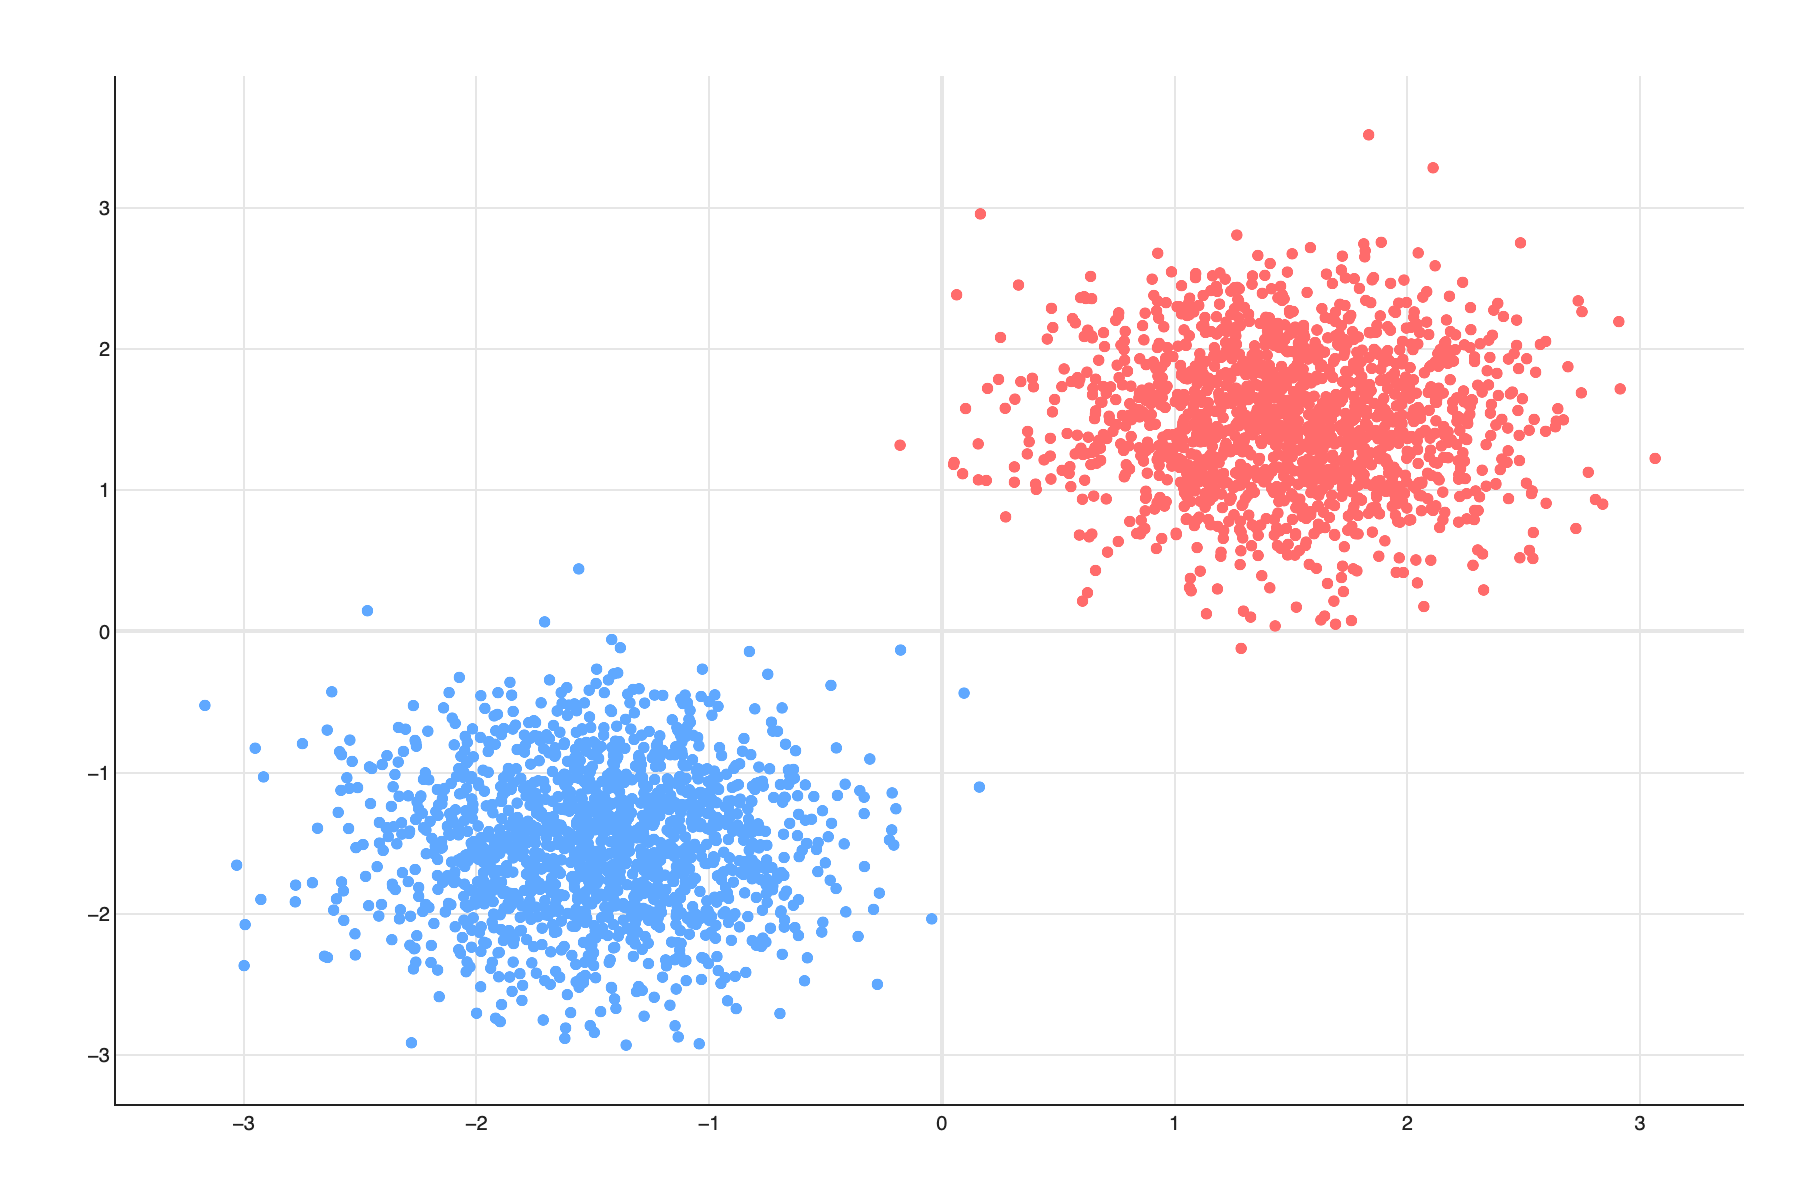
Multi-trace figures — an
Overlayas Plotly traces; picks carry the series id. -
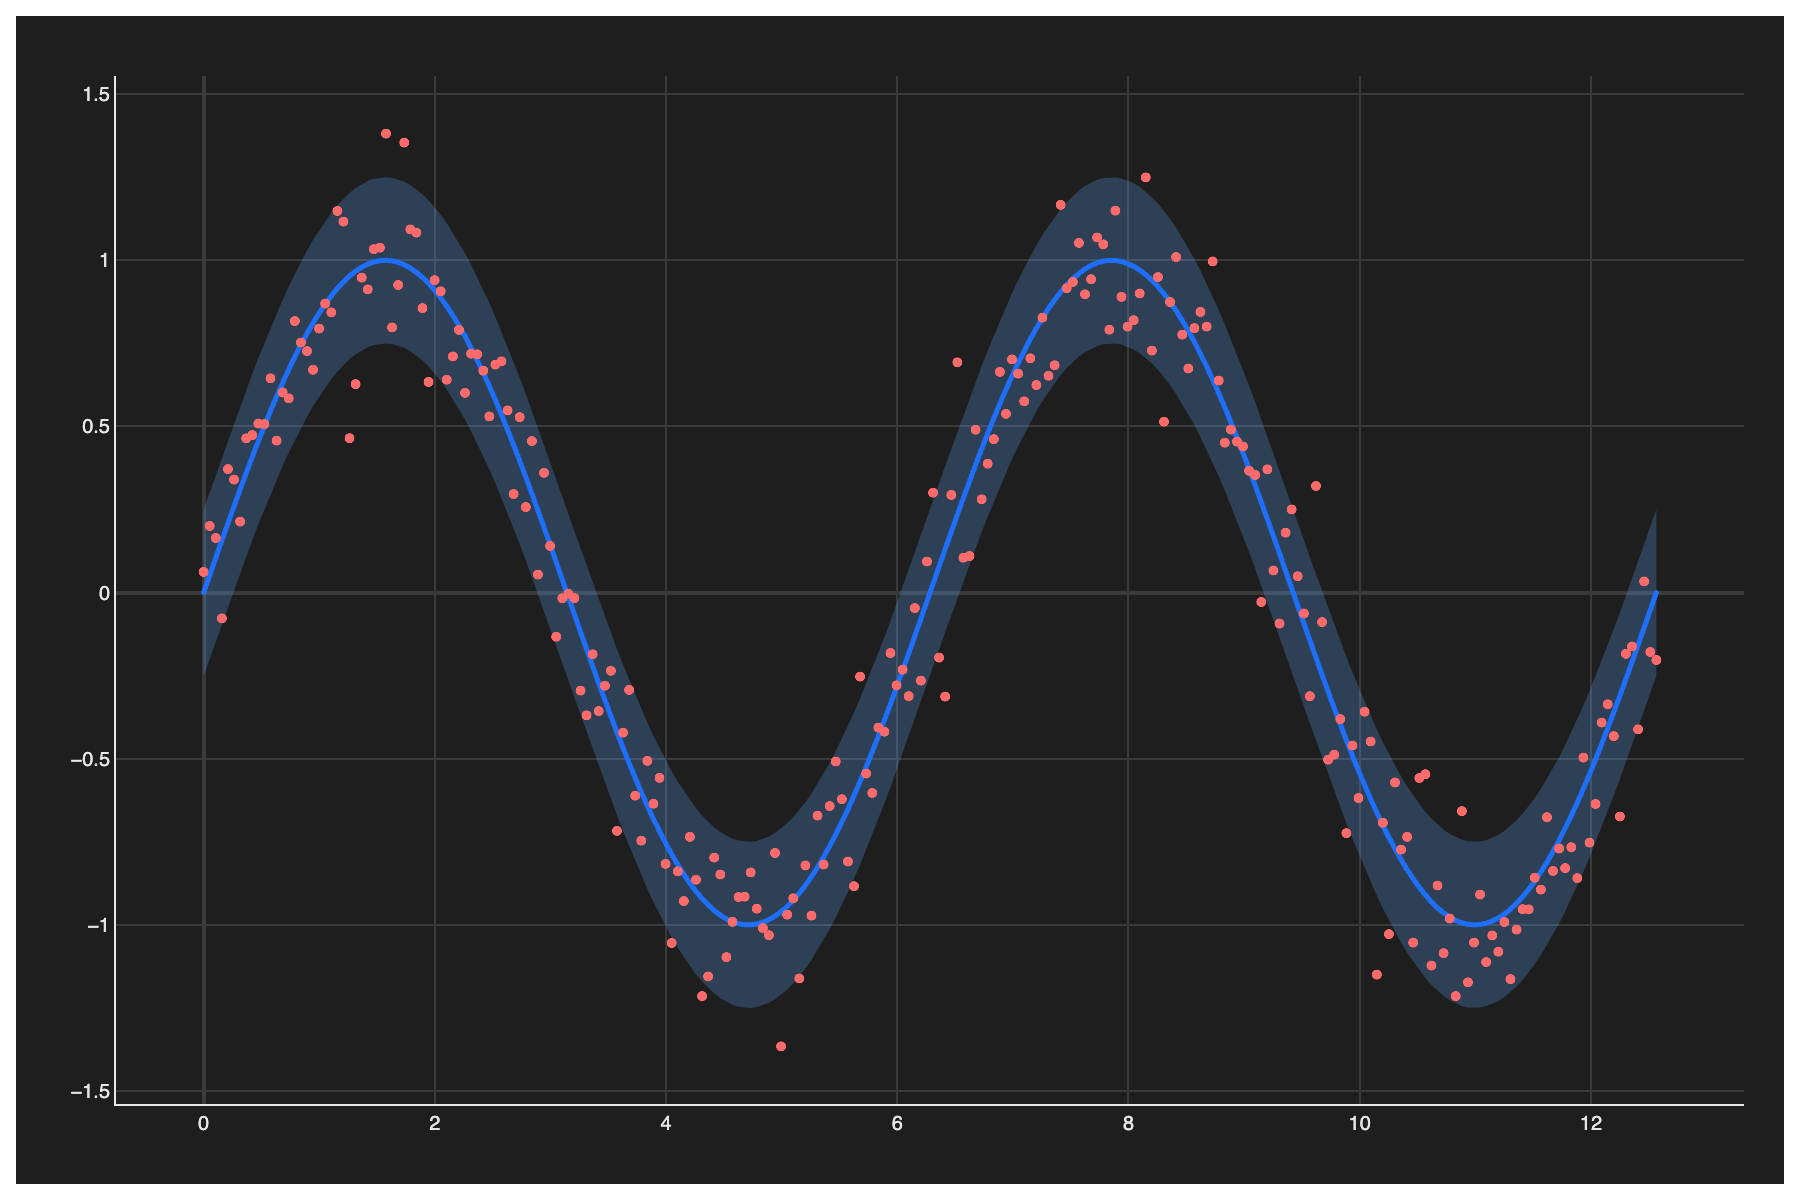
Mixed elements, one figure — Spread + Curve + Scatter together.
-
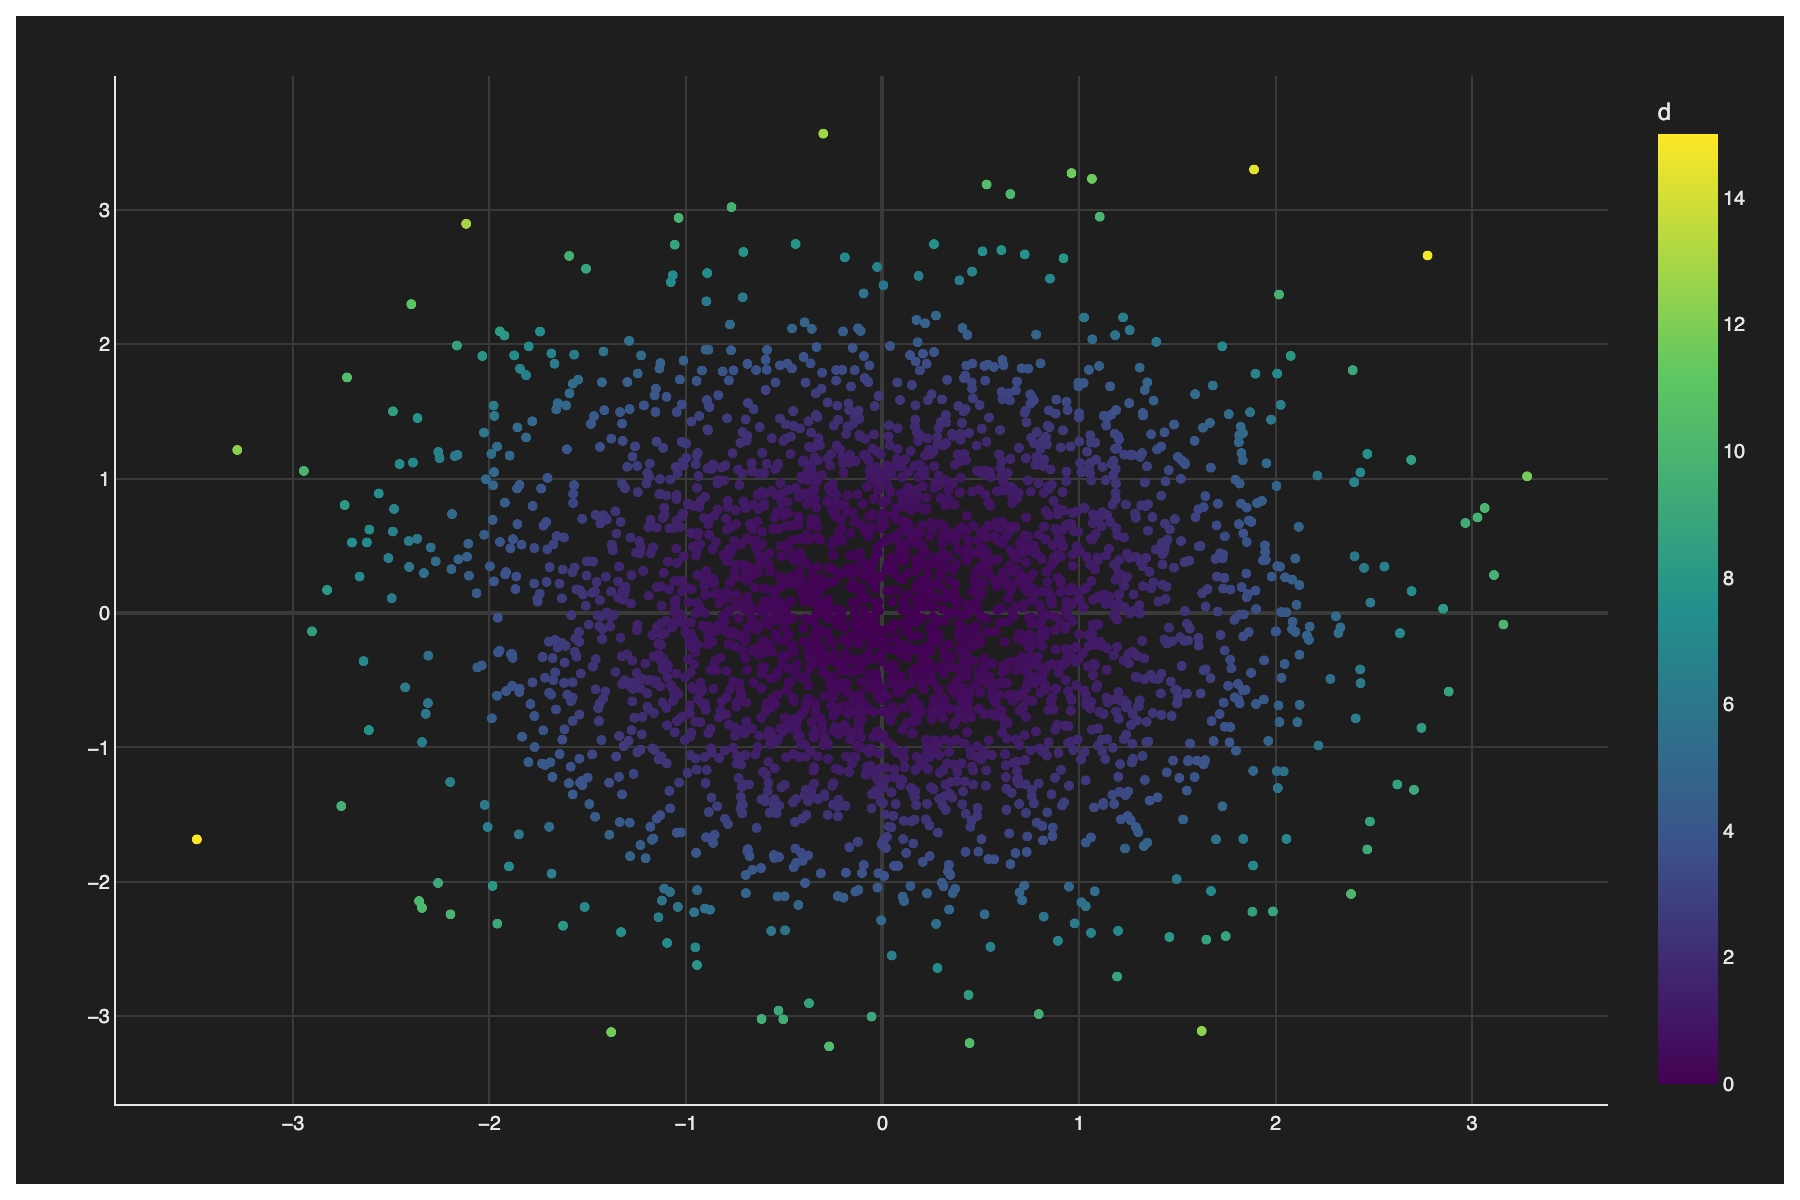
PNG export —
view.handle.export("png", path). -
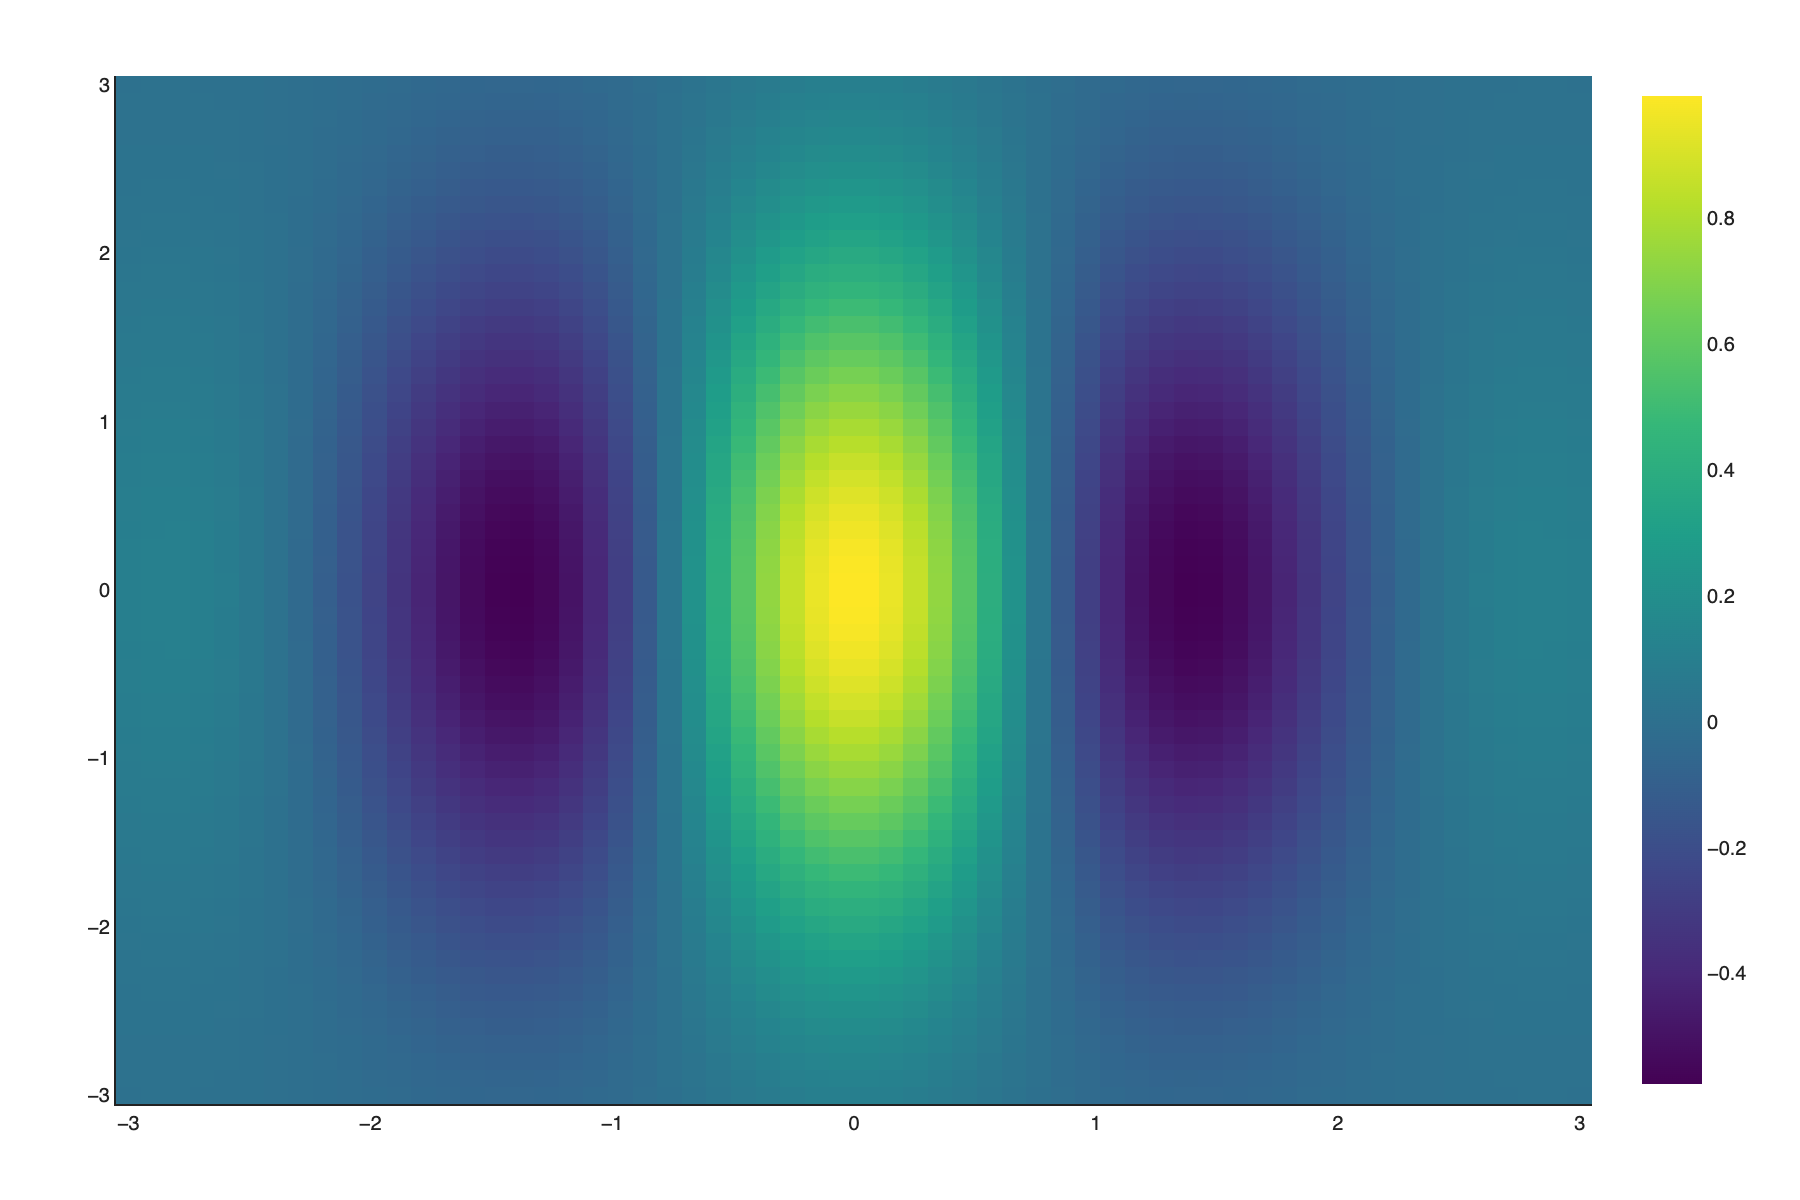
Plotly heatmap — a tabular
Heatmapwith a Viridis colorscale. -
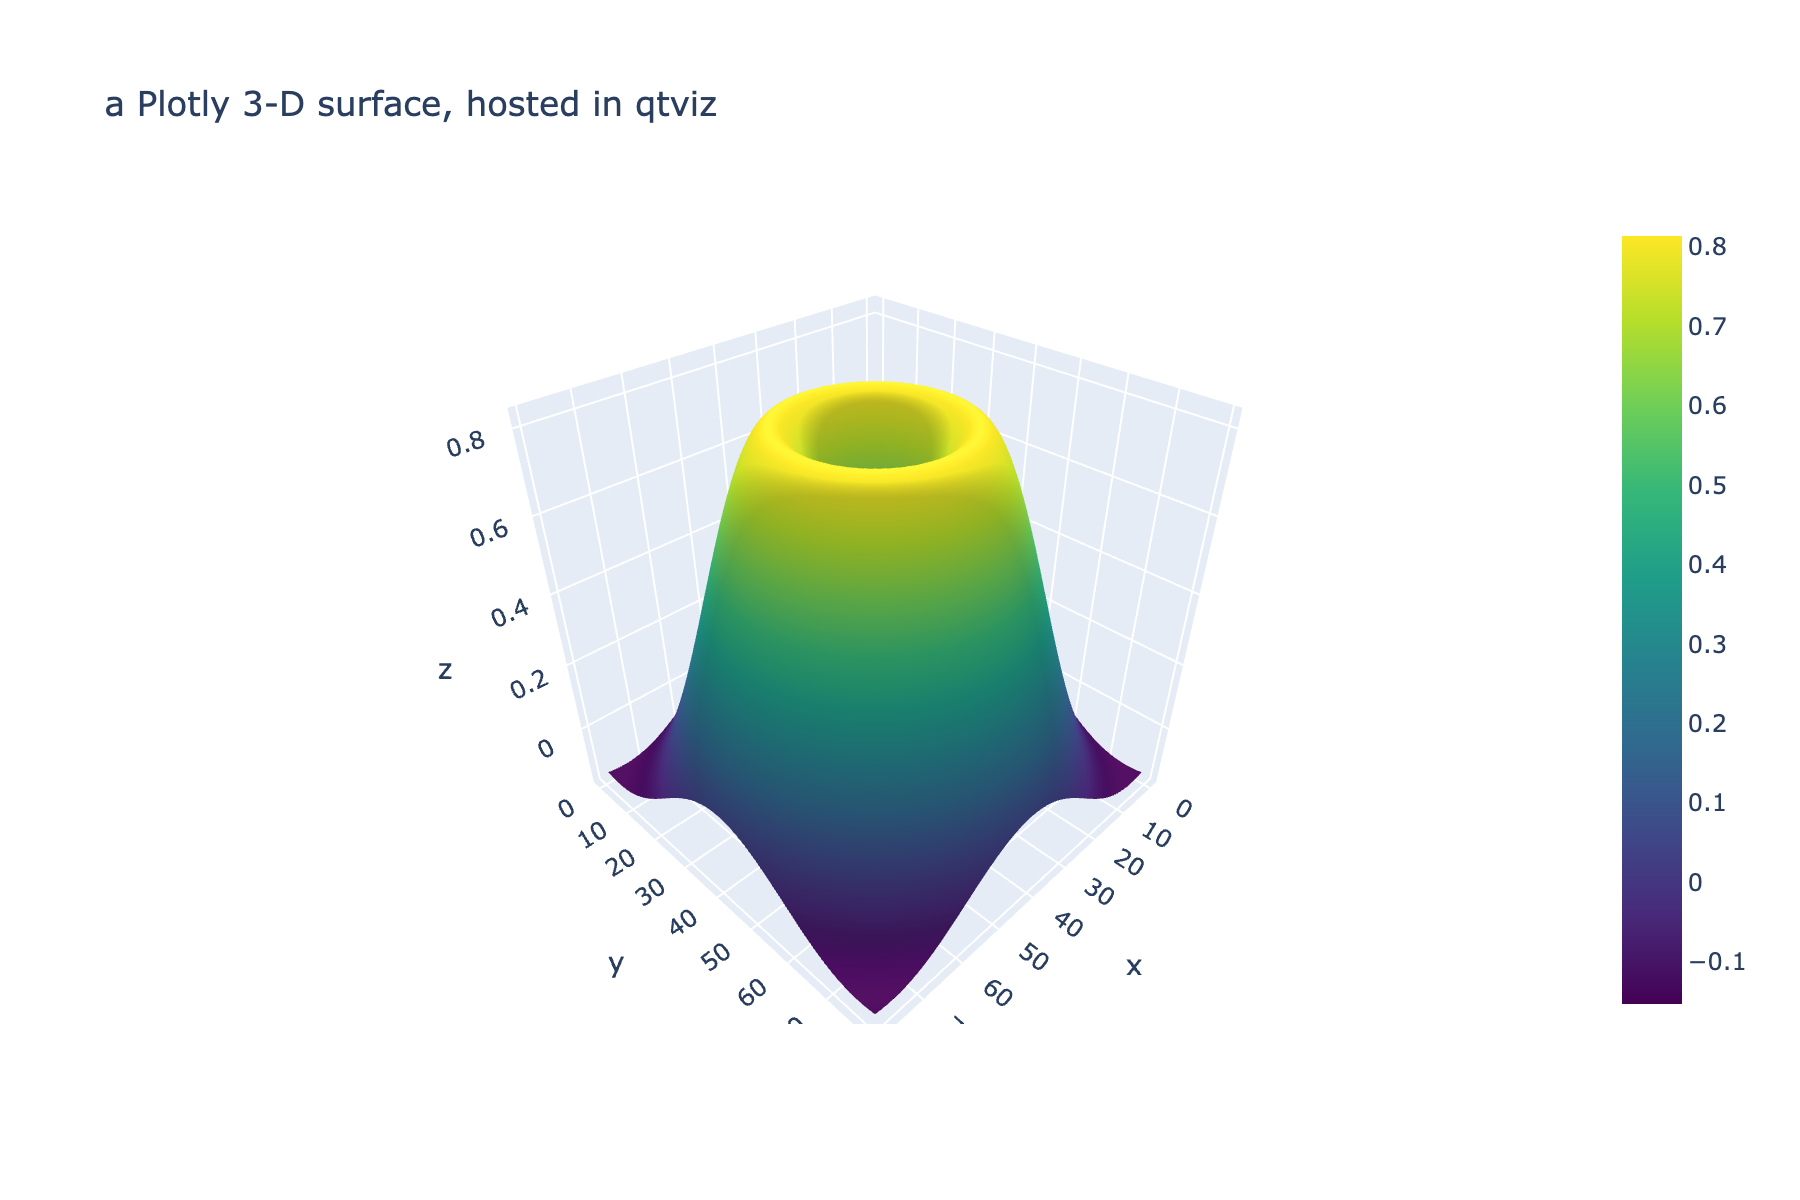
RawFigure passthrough — host a Plotly 3-D surface; events still bridge back.
-
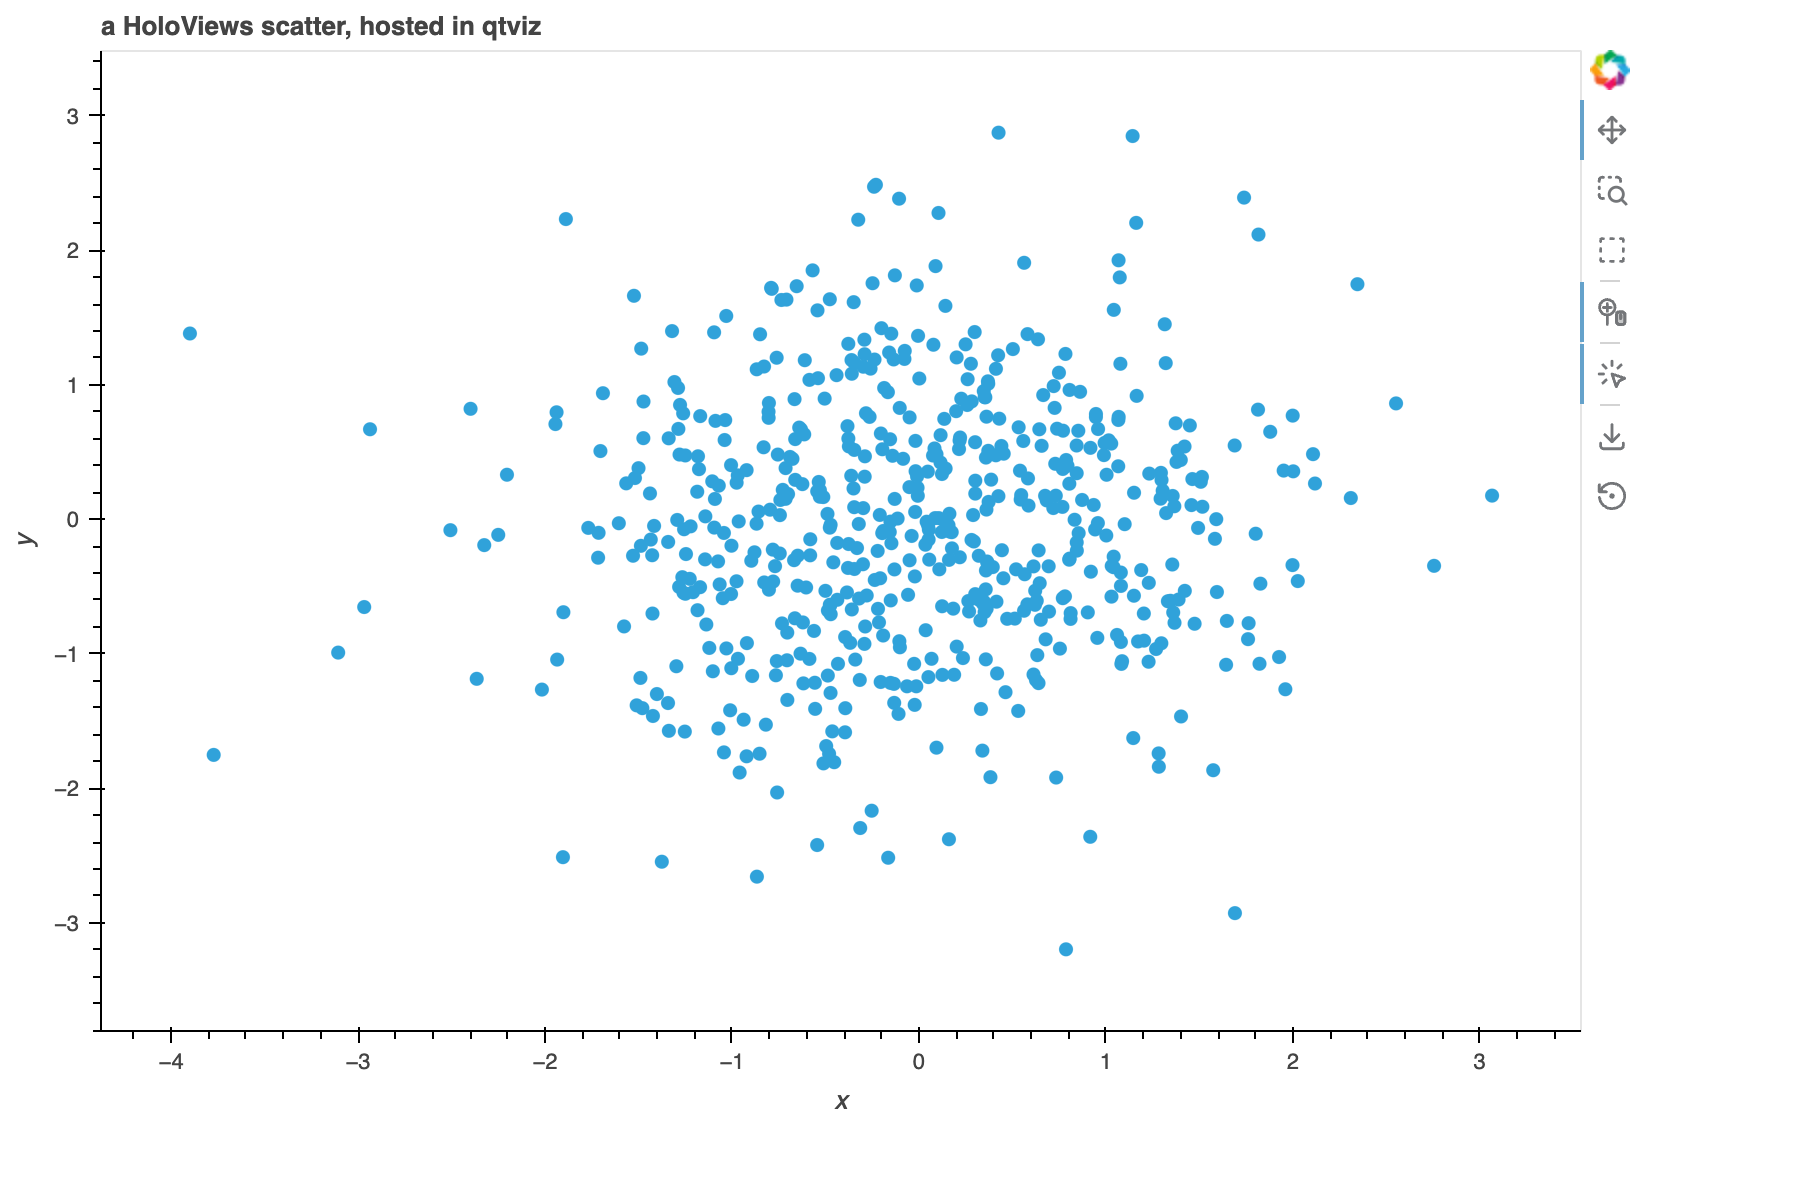
HoloViews via Bokeh — tap / box-select / range as typed qtviz events.
-
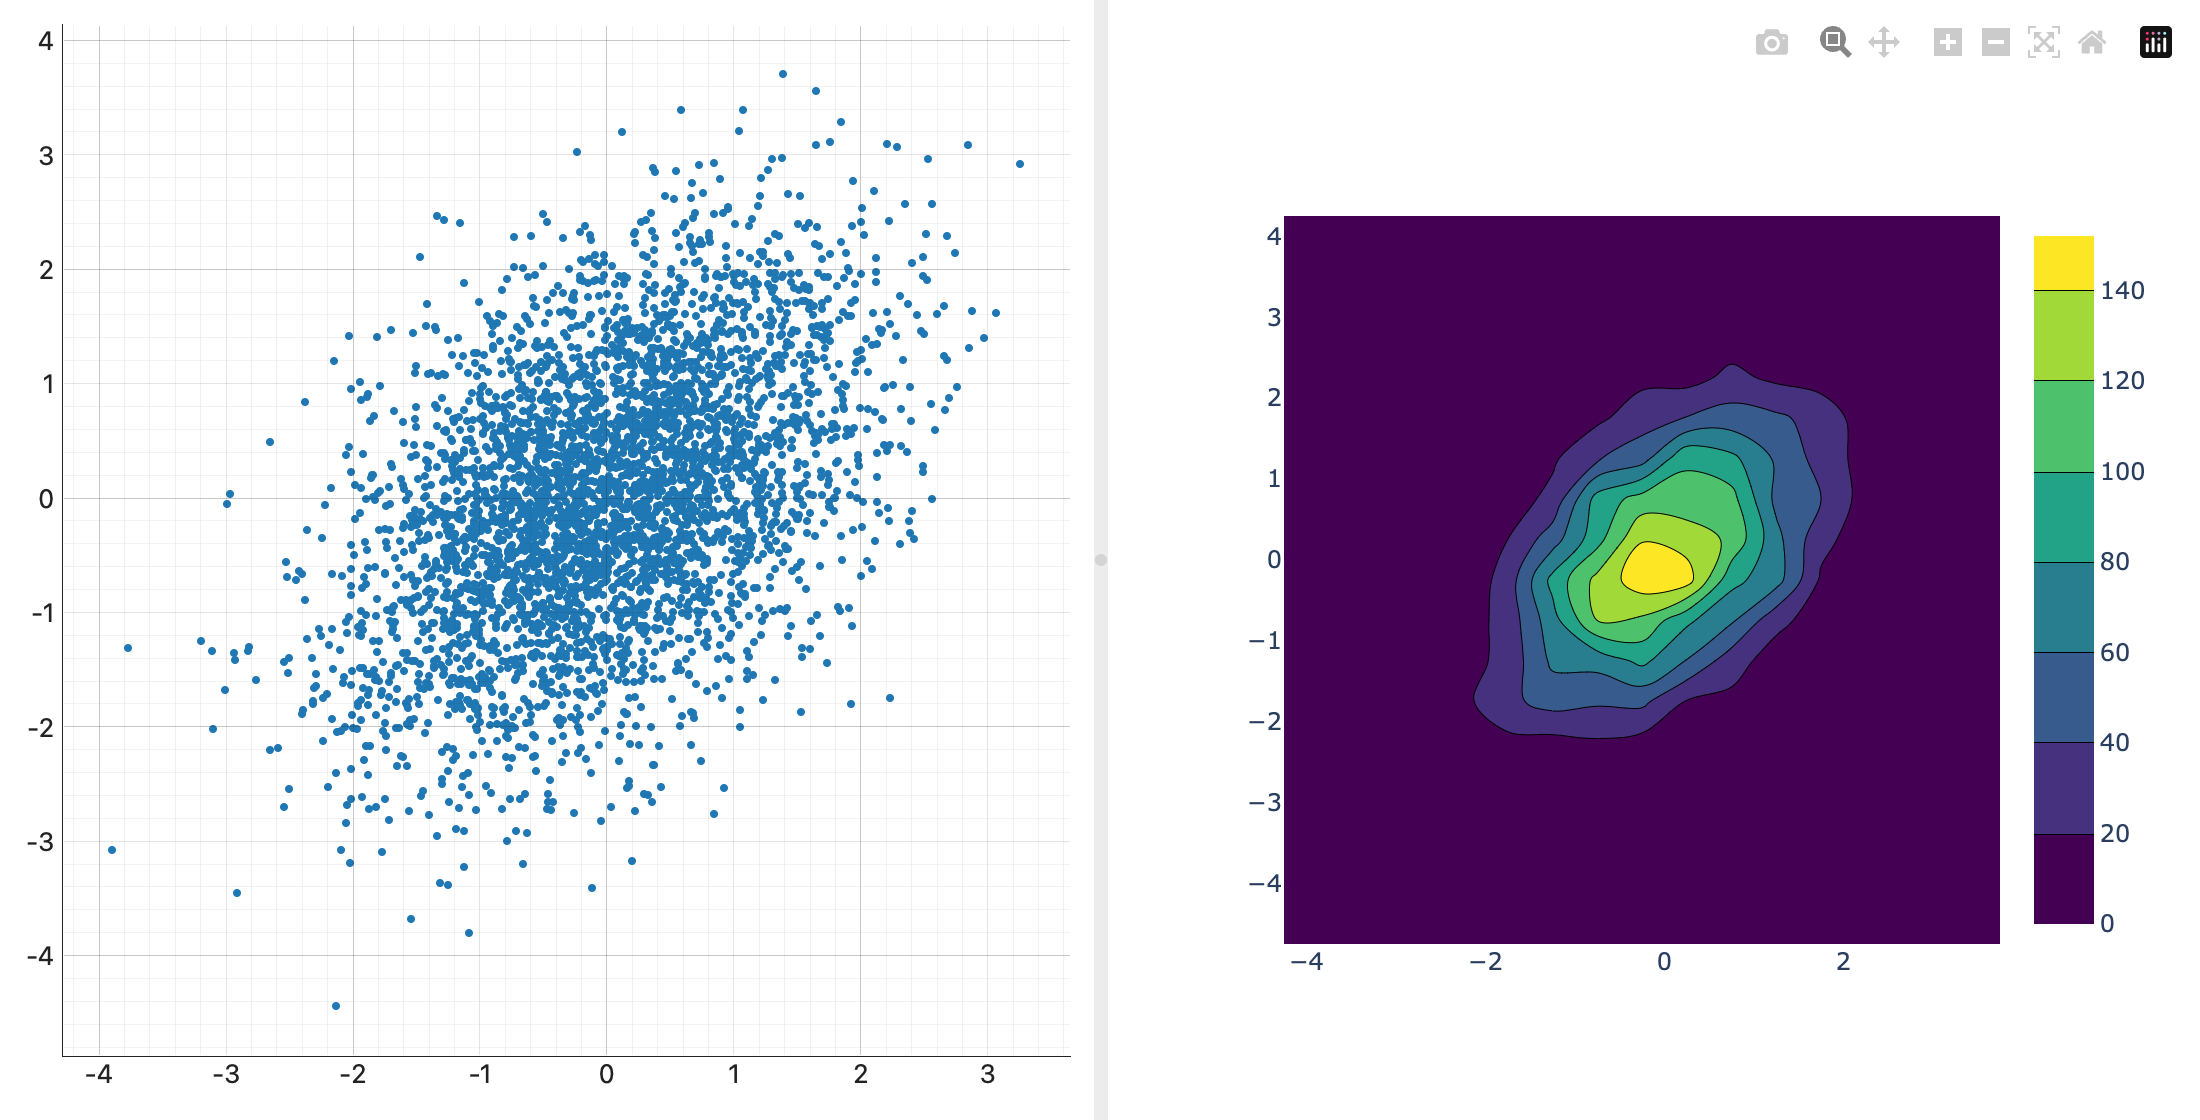
Native beside web — one window, one event stream, two engines.
The full index with per-example notes and required extras lives in
examples/README.md;
regenerate every screenshot with uv run python tools/capture_screenshots.py.