qtviz
Declarative, native-Qt plotting for data-intensive desktop apps.
Describe a plot once as immutable data, then render it through whichever engine fits
the moment — pyqtgraph (fast, OpenGL, interactive), matplotlib
(publication-quality, vector export), or webengine (interactive Plotly in an
embedded browser view). The same Element draws identically on all three, swaps
backends at runtime, and drops into any PySide6 application as a plain QWidget.
import numpy as np

import qtviz as qv

x = np.linspace(0, 10, 500)
qv.show(qv.Scatter({"x": x, "y": np.sin(x)}, x="x", y="y"), title="hello")
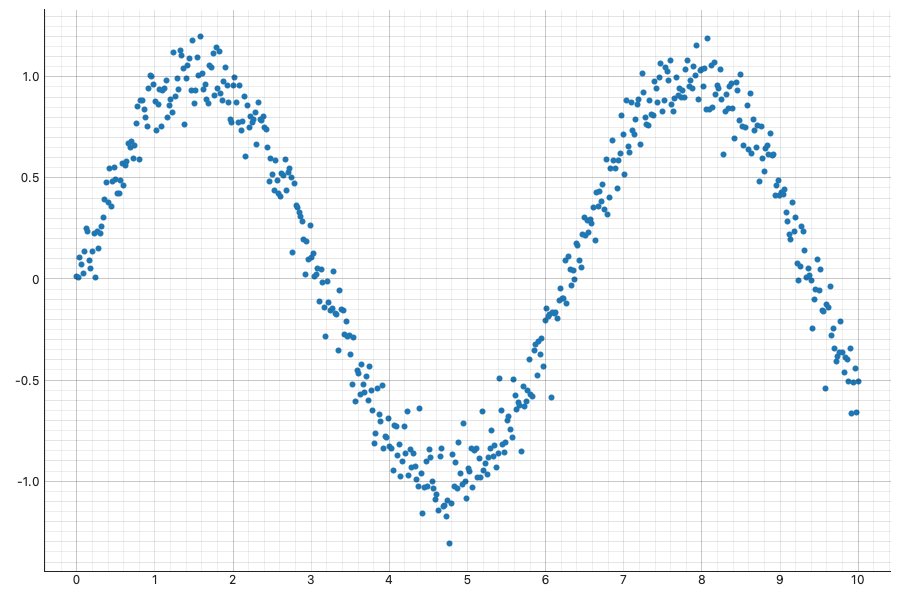
That is a complete program: a real Qt window, an OpenGL-accelerated scatter, pan and
zoom out of the box. Change one keyword — backend="matplotlib" or
backend="webengine" — and the same line renders through a different engine. In a
real application, skip show() and drop qv.View(...) into your layout like any
QWidget.
Why qtviz?
- One immutable API, many backends. An
Elementis pure, value-hashed data — it says what to plot, never how. Pick a backend per view, swap at runtime, or mix backends in one window. - Native Qt, not a web app in disguise. The default backends are real
QWidgets with Qt signals/slots and strict GUI-thread discipline. - Runs 100% offline. No network at render time, ever — a hard requirement. The
webengine backend inlines its JavaScript at render time from your locally
installed
plotly/bokehpackages (never a CDN; nothing is vendored — plotly.js and BokehJS remain under their own MIT / BSD-3-Clause licenses). - Engineered for large data. Container-agnostic, lazy-first data layer (dict / NumPy / pandas / Arrow eager; Dask / xarray / zarr out-of-core) plus Datashader so 10M+ points become a screen-resolution raster that re-aggregates on zoom.
- No dead ends. Wrap anything qtviz doesn't natively model in
RawFigureand host it in the sameView. - The everyday figures, declaratively. Twenty-eight elements cover the charts the popular libraries make routinely — step/area/pie/ECDF/contour, grouped and horizontal bars, box/violin with one shared statistics core — plus calendar-time axes, twin y axes, and tick formatting.
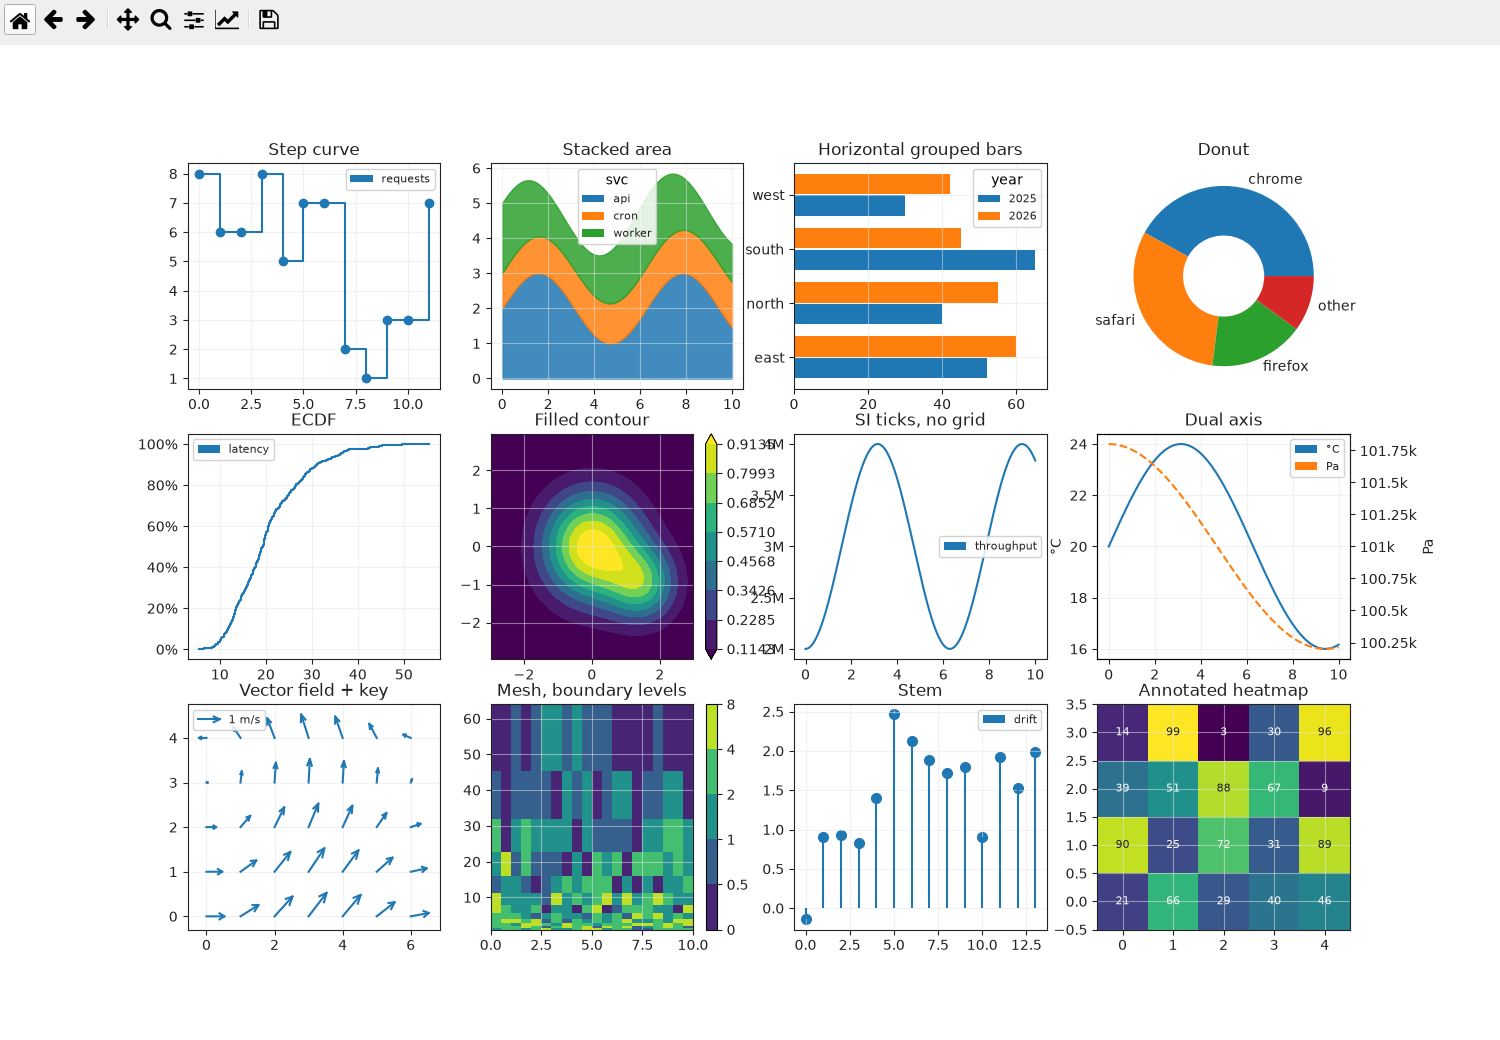
The everyday figures in one Layout grid —
examples/35_everyday_figures.py.
Install
pip install qtviz                      # or:  uv add qtviz
pip install "qtviz[matplotlib]"        # + the matplotlib backend
pip install "qtviz[all]"               # everything
The hard dependencies are PySide6, pyqtgraph, and numpy; everything else
(matplotlib, webengine, datashader, dask, xarray, hvplot) is an
opt-in extra.
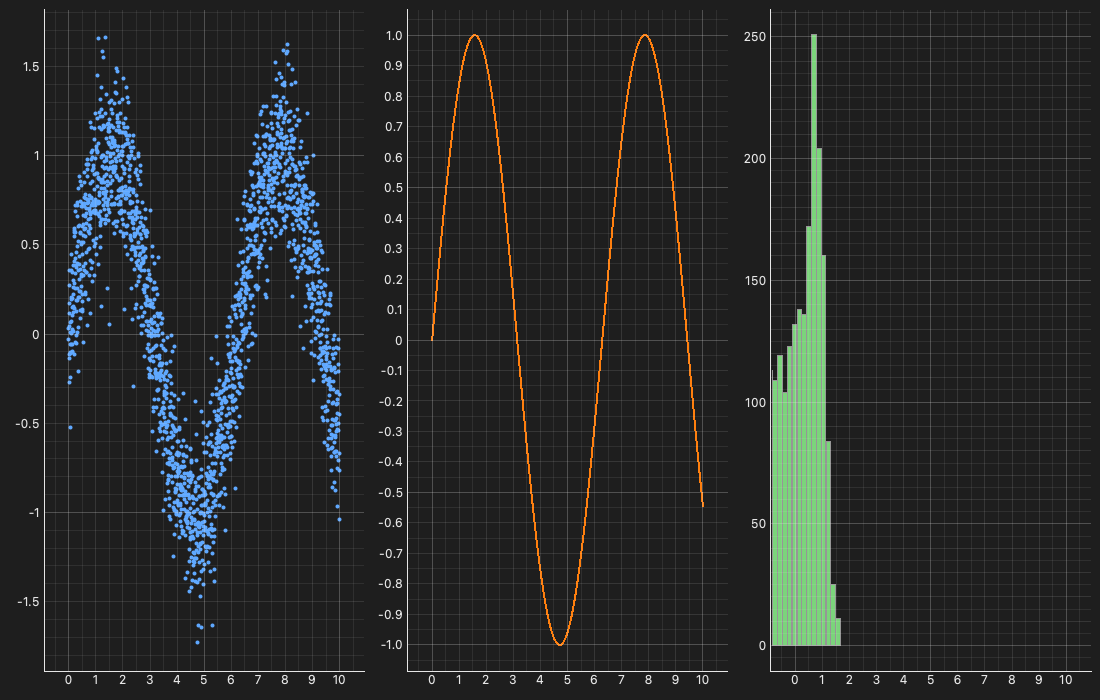
A linked three-panel dashboard in under sixty lines —
examples/dashboard_native.py.
Where next
-
Install → first plot → first dashboard, then the whole surface at a glance.
-
A screenshot of every runnable example — dashboards, big data, WebEngine, adapters.
-
All 71 public names, auto-documented from the frozen surface.
-
The extension contract: ~8 mark drawers and a conformance suite to make green.